5.3. PHÂN TÍCH NHÂN TỐ KHÁM PHÁ EFA
Bảng 1. Phân tích các nhân tố ảnh hưởng đến Sự phát triển du lịch sinh thái
Kaiser-Meyer-Olkin Measure of Sampling Adequacy. | ,829 | |
Bartlett's Test of Sphericity | Approx. Chi-Square | 5707,281 |
df | 465 | |
Sig. | ,000 | |
Có thể bạn quan tâm!
-

 Ý Kiến Chuyên Gia, Thang Đo Sơ Bộ Lần 1 Danh Sách Chuyên Gia
 -
 Kiểm Định Độ Tin Cậy Của Thang Đo Đối Với Nhân Tố Giá Cả Dịch Vụ Hợp Lý.
 -
 Các nhân tố ảnh hưởng đến phát triển du lịch sinh thái tỉnh Tiền Giang - 14
Xem toàn bộ 124 trang tài liệu này.
Component | Initial Eigenvalues | Extraction Sums of Squared Loadings | Rotation Sums of Squared Loadings | ||||||
Total | % of Variance | Cumulative % | Total | % of Variance | Cumulative % | Total | % of Variance | Cumulati ve % | |
1 | 9,132 | 29,459 | 29,459 | 9,132 | 29,459 | 29,459 | 5,944 | 19,175 | 19,175 |
2 | 4,063 | 13,106 | 42,565 | 4,063 | 13,106 | 42,565 | 4,632 | 14,941 | 34,116 |
3 | 3,536 | 11,407 | 53,972 | 3,536 | 11,407 | 53,972 | 4,027 | 12,989 | 47,106 |
4 | 3,092 | 9,974 | 63,946 | 3,092 | 9,974 | 63,946 | 3,214 | 10,368 | 57,473 |
5 | 2,538 | 8,188 | 72,134 | 2,538 | 8,188 | 72,134 | 3,202 | 10,328 | 67,802 |
6 | 1,778 | 5,734 | 77,868 | 1,778 | 5,734 | 77,868 | 3,121 | 10,067 | 77,868 |
7 | ,738 | 2,380 | 80,248 | ||||||
8 | ,634 | 2,046 | 82,294 | ||||||
9 | ,588 | 1,895 | 84,189 | ||||||
10 | ,528 | 1,705 | 85,894 | ||||||
11 | ,471 | 1,519 | 87,412 | ||||||
12 | ,424 | 1,368 | 88,781 | ||||||
13 | ,384 | 1,240 | 90,021 | ||||||
14 | ,346 | 1,116 | 91,137 | ||||||
15 | ,305 | ,983 | 92,120 | ||||||
16 | ,277 | ,894 | 93,014 | ||||||
17 | ,254 | ,819 | 93,833 | ||||||
18 | ,242 | ,781 | 94,614 | ||||||
19 | ,228 | ,737 | 95,351 | ||||||
20 | ,226 | ,730 | 96,080 | ||||||
21 | ,193 | ,621 | 96,701 | ||||||
22 | ,173 | ,559 | 97,260 | ||||||
23 | ,157 | ,508 | 97,768 | ||||||
24 | ,153 | ,494 | 98,262 | ||||||
25 | ,130 | ,418 | 98,680 | ||||||
26 | ,102 | ,328 | 99,008 | ||||||
27 | ,095 | ,307 | 99,315 | ||||||
,068 | ,220 | 99,535 | ||||||||||
29 | ,057 | ,183 | 99,718 | |||||||||
30 | ,050 | ,162 | 99,880 | |||||||||
31 | ,037 | ,120 | 100,000 | |||||||||
Extraction Method: Principal Component Analysis. | ||||||||||||
Rotated Component Matrixa | ||||||||||||
Component | ||||||||||||
1 | 2 | 3 | 4 | 5 | 6 | |||||||
HT3 | ,876 | |||||||||||
HT1 | ,867 | |||||||||||
HT4 | ,865 | |||||||||||
HT7 | ,837 | |||||||||||
HT6 | ,835 | |||||||||||
HT8 | ,826 | |||||||||||
HT5 | ,809 | |||||||||||
HT2 | ,794 | |||||||||||
MT2 | ,913 | |||||||||||
MT3 | ,881 | |||||||||||
MT5 | ,855 | |||||||||||
MT1 | ,832 | |||||||||||
MT4 | ,818 | |||||||||||
MT6 | ,729 | |||||||||||
NL2 | ,939 | |||||||||||
NL3 | ,904 | |||||||||||
NL1 | ,877 | |||||||||||
NL4 | ,832 | |||||||||||
NL5 | ,805 | |||||||||||
AN1 | ,895 | |||||||||||
AN2 | ,870 | |||||||||||
AN3 | ,843 | |||||||||||
AN4 | ,800 | |||||||||||
GC3 | ,878 | |||||||||||
GC4 | ,864 | |||||||||||
GC2 | ,803 | |||||||||||
GC1 | ,764 | |||||||||||
CS1 | ,916 | |||||||||||
CS3 | ,863 | |||||||||||
CS2 | ,790 | |||||||||||
CS4 | ,790 | |||||||||||
28
Extraction Method: Principal Component Analysis. Rotation Method: Varimax with Kaiser Normalization.
a. Rotation converged in 6 iterations.
Bảng 2. Phân tích nhân tố thang đo Sự phát triển du lịch sinh thái
Kaiser-Meyer-Olkin Measure of Sampling Adequacy. | ||
,819 | ||
Bartlett's Test of Sphericity | Approx. Chi-Square | |
895,576 | ||
df | 10 | |
Sig. | ,000 | |
Total Variance Explained
Initial Eigenvalues | Extraction Sums of Squared Loadings | |||||
Total | % of Variance | Cumulative % | Total | % of Variance | Cumulative % | |
1 | 3,824 | 76,475 | 76,475 | 3,824 | 76,475 | 76,475 |
2 | ,498 | 9,963 | 86,437 | |||
3 | ,383 | 7,653 | 94,091 | |||
4 | ,249 | 4,981 | 99,072 | |||
5 | ,046 | ,928 | 100,000 |
Extraction Method: Principal Component Analysis.
Component Matrixa
Component | |
1 | |
PT2 | ,939 |
PT5 | ,927 |
PT3 | ,862 |
PT1 | ,822 |
PT4 | ,814 |
Extraction Method: Principal Component Analysis.
a. 1 components extracted.
5.4. MA TRẬN TƯƠNG QUAN Ma trận hệ số tương quan giữa các biến
Correlations
PT | HT | GC | NL | AN | CS | MT | ||
PT | Pearson Correlation | 1 | ,463** | ,646** | ,488** | ,533** | ,387** | ,610** |
Sig. (2-tailed) | ,000 | ,000 | ,000 | ,000 | ,000 | ,000 | ||
N | 191 | 191 | 191 | 191 | 191 | 191 | 191 | |
HT | Pearson Correlation | ,463** | 1 | ,267** | ,203** | ,178* | ,194** | ,325** |
Sig. (2-tailed) | ,000 | ,000 | ,005 | ,014 | ,007 | ,000 | ||
N | 191 | 191 | 191 | 191 | 191 | 191 | 191 | |
GC | Pearson Correlation | ,646** | ,267** | 1 | ,290** | ,399** | ,163* | ,387** |
Sig. (2-tailed) | ,000 | ,000 | ,000 | ,000 | ,024 | ,000 | ||
N | 191 | 191 | 191 | 191 | 191 | 191 | 191 | |
NL | Pearson Correlation | ,488** | ,203** | ,290** | 1 | ,153* | ,212** | ,168* |
Sig. (2-tailed) | ,000 | ,005 | ,000 | ,035 | ,003 | ,021 | ||
N | 191 | 191 | 191 | 191 | 191 | 191 | 191 | |
AN | Pearson Correlation | ,533** | ,178* | ,399** | ,153* | 1 | ,278** | ,207** |
Sig. (2-tailed) | ,000 | ,014 | ,000 | ,035 | ,000 | ,004 | ||
N | 191 | 191 | 191 | 191 | 191 | 191 | 191 | |
CS | Pearson Correlation | ,405** | ,194** | ,163* | ,212** | ,278** | 1 | ,163* |
Sig. (2-tailed) | ,000 | ,007 | ,024 | ,003 | ,000 | ,024 | ||
N | 191 | 191 | 191 | 191 | 191 | 191 | 191 | |
MT | Pearson Correlation | ,610** | ,325** | ,387** | ,168* | ,207** | ,163* | 1 |
Sig. (2-tailed) | ,000 | ,000 | ,000 | ,021 | ,004 | ,024 | ||
N | 191 | 191 | 191 | 191 | 191 | 191 | 191 |
**. Correlation is significant at the 0.01 level (2-tailed).
*. Correlation is significant at the 0.05 level (2-tailed).
5.5. PHÂN TÍCH HỒI QUY TUYẾN TÍNH Bảng 1. Bảng kết quả hệ sốhiệu chỉnh
Model Summaryb
R | R Square | Adjusted R Square | Std. Error of the Estimate | Durbin-Watson | |
1 | ,875a | ,766 | ,758 | ,36777 | 1,872 |
a. Predictors: (Constant), MT, CS, NL, AN, HT, GC
b. Dependent Variable: PT
Bảng 2. Bảng kết kiểm định F
ANOVAa
Sum of Squares | df | Mean Square | F | Sig. | ||
1 | Regression | 81,400 | 6 | 13,567 | 100,307 | ,000b |
Residual | 24,886 | 184 | ,135 | |||
Total | 106,287 | 190 |
a. Dependent Variable: PT
b. Predictors: (Constant), MT, CS, NL, AN, HT, GC
Bảng 3. Bảng thông số thống kê của các biến trong phương trình hồi quy
Coefficientsa
Unstandardized Coefficients | Standardized Coefficients | t | Sig. | Collinearity Statistics | ||||
B | Std. Error | Beta | Tolerance | VIF | ||||
1 | (Constant) | -,877 | ,185 | -4,729 | ,000 | |||
HT | ,131 | ,032 | ,158 | 4,068 | ,000 | ,844 | 1,184 | |
GC | ,240 | ,037 | ,280 | 6,560 | ,000 | ,701 | 1,427 | |
NL | ,233 | ,035 | ,253 | 6,636 | ,000 | ,877 | 1,141 | |
AN | ,215 | ,035 | ,249 | 6,205 | ,000 | ,792 | 1,262 | |
CS | ,134 | ,038 | ,134 | 3,510 | ,001 | ,876 | 1,142 | |
MT | ,287 | ,034 | ,335 | 8,356 | ,000 | ,792 | 1,262 |
a. Dependent Variable: PT
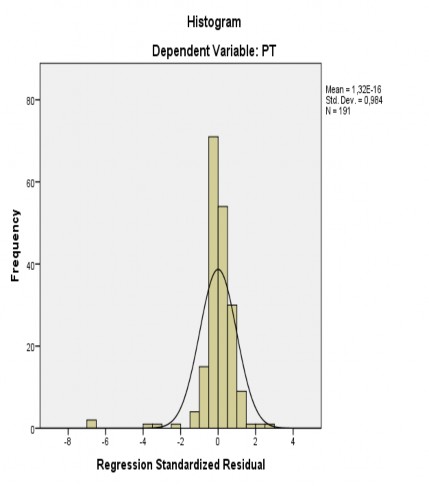
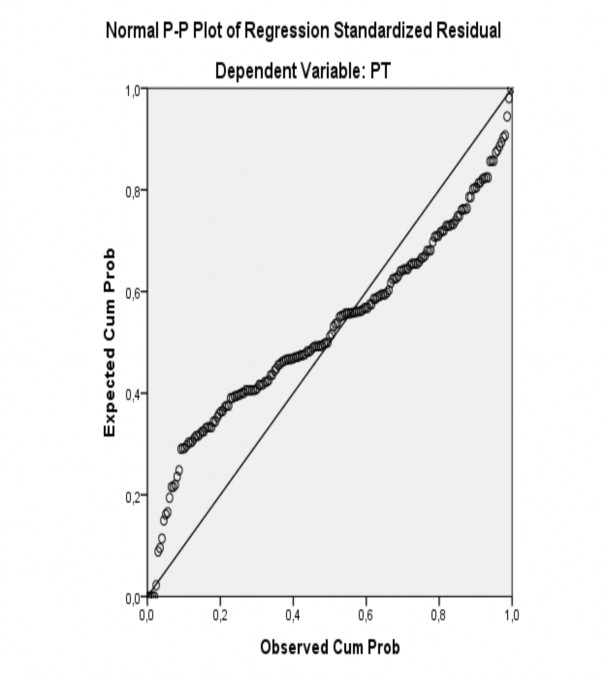
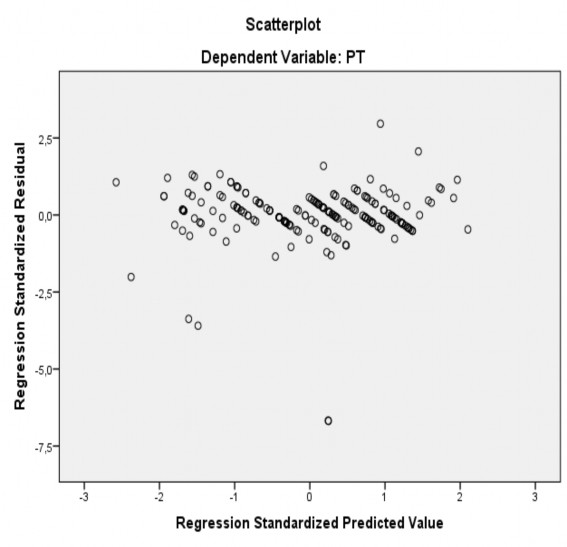
5.6. KẾT QUẢ KIỂM ĐỊNH PHẦN DƯ CÓ PHÂN PHỐI CHUẨN Biểu đồ 1. Biểu đồ tần số Histogram