Component Transformation Matrix
1 | 2 | 3 | 4 | 5 | 6 | |
1 | .483 | .394 | .439 | .450 | .339 | .317 |
2 | -.678 | .434 | .372 | -.278 | .368 | -.022 |
3 | .009 | -.777 | .381 | -.066 | .496 | -.013 |
4 | .312 | .204 | -.398 | -.156 | .584 | -.581 |
5 | -.027 | -.019 | -.510 | -.246 | .349 | .746 |
6 | .456 | .102 | .323 | -.795 | -.201 | .072 |
Có thể bạn quan tâm!
-

 Rất Không Đồng Ý (Với Nhận Định); 2. Không Đồng Ý; 3. Bình Thường;
 -
 Kiểm Định Độ Tin Cậy Của Thang Đo (Thành Phần Độ Tin Cậy)
 -
 Sự hài lòng của các doanh nghiệp với việc cung cấp dịch vụ hành chính công tại tỉnh Bà Rịa – Vũng Tàu - 15
 -
 Sự hài lòng của các doanh nghiệp với việc cung cấp dịch vụ hành chính công tại tỉnh Bà Rịa – Vũng Tàu - 17
Xem toàn bộ 144 trang tài liệu này.
Extraction Method: Principal Component Analysis. Rotation Method: Varimax with Kaiser Normalization.
Bảng 11. Kết quả phân tích nhân tố khám phá với nhân tố hài lòng
KMO and Bartlett's Test
.664 | |
Approx. Chi-Square | 98.807 |
Bartlett's Test of Sphericity df | 3 |
Sig. | .000 |
Communalities
Initial | Extraction | |
HL1 | 1.000 | .621 |
HL2 | 1.000 | .638 |
HL3 | 1.000 | .575 |
Total Variance Explained
Initial Eigenvalues | Extraction Sums of Squared Loadings | |||||
Total | % of Variance | Cumulative % | Total | % of Variance | Cumulative % | |
1 | 1.834 | 61.136 | 61.136 | 1.834 | 61.136 | 61.136 |
2 | .621 | 20.695 | 81.831 | |||
3 | .545 | 18.169 | 100.000 |
Component Matrixa
Component | |
1 | |
HL2 | .799 |
HL1 | .788 |
HL3 | .758 |
Bảng 12. Kết quả phân tích tương quan
Correlations
HL | TC | NL | DC | DU | CP | VC | ||
Pearson Correlation | 1 | .556** | .570** | .464** | .641** | .468** | .470** | |
HL | Sig. (2-tailed) | .000 | .000 | .000 | .000 | .000 | .000 | |
N | 210 | 210 | 210 | 210 | 210 | 210 | 210 | |
Pearson Correlation | .556** | 1 | .556** | .251** | .289** | .246** | .294** | |
TC | Sig. (2-tailed) | .000 | .000 | .000 | .000 | .000 | .000 | |
N | 210 | 210 | 210 | 210 | 210 | 210 | 210 | |
Pearson Correlation | .570** | .556** | 1 | .375** | .445** | .281** | .387** | |
NL | Sig. (2-tailed) | .000 | .000 | .000 | .000 | .000 | .000 | |
N | 210 | 210 | 210 | 210 | 210 | 210 | 210 | |
Pearson Correlation | .464** | .251** | .375** | 1 | .395** | .323** | .279** | |
DC | Sig. (2-tailed) | .000 | .000 | .000 | .000 | .000 | .000 | |
N | 210 | 210 | 210 | 210 | 210 | 210 | 210 | |
Pearson Correlation | .641** | .289** | .445** | .395** | 1 | .397** | .362** | |
DU | Sig. (2-tailed) | .000 | .000 | .000 | .000 | .000 | .000 | |
N | 210 | 210 | 210 | 210 | 210 | 210 | 210 | |
Pearson Correlation | .468** | .246** | .281** | .323** | .397** | 1 | .204** | |
CP | Sig. (2-tailed) | .000 | .000 | .000 | .000 | .000 | .003 | |
N | 210 | 210 | 210 | 210 | 210 | 210 | 210 | |
Pearson Correlation | .470** | .294** | .387** | .279** | .362** | .204** | 1 | |
VC | Sig. (2-tailed) | .000 | .000 | .000 | .000 | .000 | .003 | |
N | 210 | 210 | 210 | 210 | 210 | 210 | 210 |
**. Correlation is significant at the 0.01 level (2-tailed).
Bảng 13. Kết quả phân tích hồi quy
Descriptive Statistics
Mean | Std. Deviation | N | |
HL | 3.0238 | .66103 | 210 |
TC | 3.8667 | .66616 | 210 |
NL | 3.8833 | .91575 | 210 |
DC | 3.0667 | .71386 | 210 |
DU | 3.0210 | .69718 | 210 |
CP | 2.9133 | .67655 | 210 |
VC | 3.9857 | .63944 | 210 |
HL | TC | NL | DC | DU | CP | VC | ||
HL | 1.000 | .556 | .570 | .464 | .641 | .468 | .470 | |
TC | .556 | 1.000 | .556 | .251 | .289 | .246 | .294 | |
NL | .570 | .556 | 1.000 | .375 | .445 | .281 | .387 | |
Pearson Correlation | DC | .464 | .251 | .375 | 1.000 | .395 | .323 | .279 |
DU | .641 | .289 | .445 | .395 | 1.000 | .397 | .362 | |
CP | .468 | .246 | .281 | .323 | .397 | 1.000 | .204 | |
VC | .470 | .294 | .387 | .279 | .362 | .204 | 1.000 | |
HL | . | .000 | .000 | .000 | .000 | .000 | .000 | |
TC | .000 | . | .000 | .000 | .000 | .000 | .000 | |
NL | .000 | .000 | . | .000 | .000 | .000 | .000 | |
Sig. (1-tailed) | DC | .000 | .000 | .000 | . | .000 | .000 | .000 |
DU | .000 | .000 | .000 | .000 | . | .000 | .000 | |
CP | .000 | .000 | .000 | .000 | .000 | . | .001 | |
VC | .000 | .000 | .000 | .000 | .000 | .001 | . | |
HL | 210 | 210 | 210 | 210 | 210 | 210 | 210 | |
TC | 210 | 210 | 210 | 210 | 210 | 210 | 210 | |
NL | 210 | 210 | 210 | 210 | 210 | 210 | 210 | |
N | DC | 210 | 210 | 210 | 210 | 210 | 210 | 210 |
DU | 210 | 210 | 210 | 210 | 210 | 210 | 210 | |
CP | 210 | 210 | 210 | 210 | 210 | 210 | 210 | |
VC | 210 | 210 | 210 | 210 | 210 | 210 | 210 |
Variables Entered/Removeda
Variables Entered | Variables Removed | Method | |
1 | VC, CP, TC, DC, DU, NLb | . | Enter |
a. Dependent Variable: HL
b. All requested variables entered.
Model Summaryb
R | R Square | Adjusted R Square | Std. Error of the Estimate | Durbin-Watson | |
1 | .802a | .643 | .632 | .40084 | 1.465 |
Sum of Squares | df | Mean Square | F | Sig. | ||
Regression | 58.709 | 6 | 9.785 | 60.898 | .000b | |
1 | Residual | 32.617 | 203 | .161 | ||
Total | 91.325 | 209 |
Model
a. Dependent Variable: HL
b. Predictors: (Constant), VC, CP, TC, DC, DU, NL
Coefficientsa
Unstandardized Coefficients | Standardized Coefficients | t | Sig. | Collinearity Statistics | ||||
B | Std. Error | Beta | Tolerance | VIF | ||||
(Constant) | -.778 | .224 | -3.472 | .001 | ||||
TC | .276 | .051 | .279 | 5.458 | .000 | .676 | 1.480 | |
NL | .081 | .040 | .113 | 2.018 | .045 | .562 | 1.778 | |
1 | DC | .112 | .044 | .121 | 2.526 | .012 | .764 | 1.309 |
DU | .325 | .049 | .343 | 6.675 | .000 | .665 | 1.503 | |
CP | .158 | .046 | .161 | 3.436 | .001 | .797 | 1.255 | |
VC | .158 | .049 | .153 | 3.239 | .001 | .790 | 1.265 |
a. Dependent Variable: HL
Collinearity Diagnosticsa
Dimension | Eigenvalue | Condition Index | Variance Proportions | |||||||
(Constant) | TC | NL | DC | DU | CP | VC | ||||
1 | 6.840 | 1.000 | .00 | .00 | .00 | .00 | .00 | .00 | .00 | |
2 | .041 | 12.973 | .00 | .06 | .19 | .05 | .03 | .50 | .02 | |
3 | .034 | 14.085 | .02 | .03 | .00 | .76 | .02 | .23 | .01 | |
1 | 4 | .031 | 14.848 | .07 | .02 | .15 | .13 | .53 | .00 | .04 |
5 | .027 | 15.780 | .04 | .02 | .28 | .05 | .31 | .22 | .14 | |
6 | .016 | 20.399 | .02 | .51 | .20 | .00 | .10 | .04 | .44 | |
7 | .010 | 25.974 | .84 | .37 | .17 | .01 | .00 | .02 | .35 |
a. Dependent Variable: HL
Residuals Statisticsa
Minimum | Maximum | Mean | Std. Deviation | N | |
Predicted Value | 1.4540 | 4.2285 | 3.0238 | .53000 | 210 |
Residual | -1.08415 | .95831 | .00000 | .39505 | 210 |
Std. Predicted Value | -2.962 | 2.273 | .000 | 1.000 | 210 |
Std. Residual | -2.705 | 2.391 | .000 | .986 | 210 |
a. Dependent Variable: HL
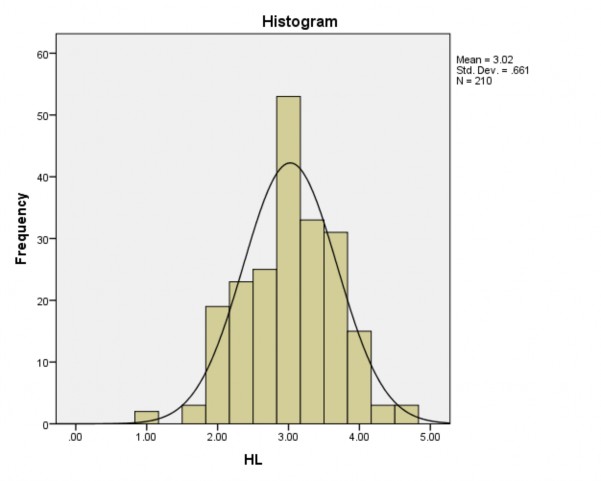
Bảng 14. Kiểm định phần dư bằng biểu đồ Histogram
HL | |
Valid | 210 |
N | |
Missing | 0 |
Mean | 3.0238 |
Median | 3.0000 |
Std. Deviation | .66103 |
Skewness | -.167 |
Std. Error of Skewness | .168 |
HL
Frequency | Percent | Valid Percent | Cumulative Percent | |
1.00 | 2 | 1.0 | 1.0 | 1.0 |
1.67 | 3 | 1.4 | 1.4 | 2.4 |
2.00 | 19 | 9.0 | 9.0 | 11.4 |
2.33 | 23 | 11.0 | 11.0 | 22.4 |
2.67 | 25 | 11.9 | 11.9 | 34.3 |
3.00 | 53 | 25.2 | 25.2 | 59.5 |
Valid | ||||
3.33 | 33 | 15.7 | 15.7 | 75.2 |
3.67 | 31 | 14.8 | 14.8 | 90.0 |
4.00 | 15 | 7.1 | 7.1 | 97.1 |
4.33 | 3 | 1.4 | 1.4 | 98.6 |
4.67 | 3 | 1.4 | 1.4 | 100.0 |
Total | 210 | 100.0 | 100.0 |
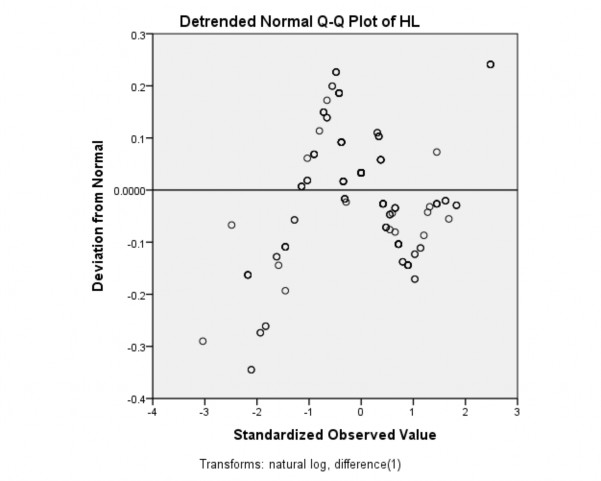
Bảng 15. Kiểm định phần dư bằng biểu đồ Q-Q Plot
Model Name | MOD_2 | |
Series or Sequence | 1 | HL |
Transformation | Natural logarithm | |
Non-Seasonal Differencing | 1 | |
Seasonal Differencing | 0 | |
Length of Seasonal Period | No periodicity | |
Standardization | Applied | |
Type | Normal | |
Distribution | Location | estimated |
Scale | estimated | |
Fractional Rank Estimation Method | Blom's | |
Rank Assigned to Ties | Mean rank of tied values | |
Applying the model specifications from MOD_2 | ||
HL | ||
Series or Sequence Length | 210 | |
Number of Missing Values in the Plot | Negative or Zero Before Log Transform | 0 |
User-Missing | 0 | |
System-Missing | 0 | |
The cases are unweighted. | ||
Estimated Distribution Parameters
HL | |
Location | .0000 |
Normal Distribution | |
Scale | 1.00000 |
The cases are unweighted.

Bảng 16. Kiểm định giá trị trung bình
N | Minimum | Maximum | Mean | Std. Deviation | |
HL1 | 210 | 1 | 5 | 3.08 | .809 |
HL2 | 210 | 1 | 5 | 3.13 | .874 |
HL3 | 210 | 1 | 4 | 2.87 | .854 |
Valid N (listwise) | 210 |
N | Minimum | Maximum | Mean | Std. Deviation | |
TC1 | 210 | 2 | 5 | 3.87 | .763 |
TC2 | 210 | 2 | 5 | 3.94 | .743 |
TC4 | 210 | 2 | 5 | 3.86 | .769 |
TC5 | 210 | 1 | 5 | 3.83 | .757 |
TC6 | 210 | 2 | 5 | 3.83 | .755 |
Valid N (listwise) | 210 |