3. Thống kê mô tả một số đặc điểm của đáp viên nhóm nhân viên
Freq. | Percent | Cum. | |
0 | 203 | 59.01 | 59.01 |
1 | 141 | 40.99 | 100.00 |
Total | 344 | 100.00 |
Có thể bạn quan tâm!
-

 Nghiên cứu mối quan hệ giữa trách nhiệm xã hội, giá trị thương hiệu và hiệu quả tài chính của các ngân hàng thương mại cổ phần tại đồng bằng sông Cửu Long - 25
 -
 Thống Kê Mô Tả Về Địa Bàn Khảo Sát Theo Tỉnh Nhóm Khách Hàng
 -
 Kết Quả Phân Tích Nhân Tố Efa Cho Khái Niệm Trách Nhiệm Xã Hội Và Giá Trị Thương Hiệu – Nhóm Khách Hàng
 -
 Nghiên cứu mối quan hệ giữa trách nhiệm xã hội, giá trị thương hiệu và hiệu quả tài chính của các ngân hàng thương mại cổ phần tại đồng bằng sông Cửu Long - 29
Xem toàn bộ 237 trang tài liệu này.
Freq. | Percent | Cum. | |
1 | 203 | 59.01 | 59.01 |
2 | 109 | 31.69 | 90.70 |
3 | 25 | 7.27 | 97.97 |
4 | 7 | 2.03 | 100.00 |
Total | 344 | 100.00 |
Freq. | Percent | Cum. | |
1 | 9 | 2.62 | 2.62 |
2 | 120 | 34.88 | 37.50 |
3 | 115 | 33.43 | 70.93 |
4 | 100 | 29.07 | 100.00 |
Total | 344 | 100.00 |
Freq. | Percent | Cum. | |
1 | 1 | 0.29 | 0.29 |
2 | 318 | 92.44 | 92.73 |
3 | 25 | 7.27 | 100.00 |
Total | 344 | 100.00 |
Freq. | Percent | Cum. | |
1 | 53 | 15.41 | 15.41 |
2 | 175 | 50.87 | 66.28 |
3 | 81 | 23.55 | 89.83 |
4 | 35 | 10.17 | 100.00 |
Total | 344 | 100.00 |
4. Kết quả kiểm định bằng phân tích Cronbach’s Alpha nhóm nhân viên
average item-test item-rest interitem
Obs | Sign | correlation | correlation | covariance | alpha | |
csr101 | 344 | + | 0.8007 | 0.6718 | .3380243 | 0.7968 |
csr102 | 344 | + | 0.7377 | 0.5934 | .3732894 | 0.8181 |
csr103 | 344 | + | 0.8098 | 0.6746 | .3261817 | 0.7960 |
csr104 | 344 | + | 0.8291 | 0.7145 | .3250206 | 0.7846 |
csr105 | 344 | + | 0.7159 | 0.5527 | .3773773 | 0.8290 |
Test scale | .3479787 0.8382 | |||||
average item-test item-rest interitem
Obs | Sign | correlation | correlation | covariance | alpha | |
csr201 | 344 | + | 0.8630 | 0.7901 | .5811852 | 0.8807 |
csr202 | 344 | + | 0.8363 | 0.7505 | .5927156 | 0.8870 |
csr203 | 344 | + | 0.8234 | 0.7448 | .6234736 | 0.8880 |
csr204 | 344 | + | 0.8108 | 0.7218 | .6189174 | 0.8910 |
csr205 | 344 | + | 0.7835 | 0.6941 | .6476981 | 0.8951 |
csr206 | 344 | + | 0.8278 | 0.7394 | .5991737 | 0.8886 |
Test scale | .6105273 0.9054 | |||||
average item-test item-rest interitem
Obs | Sign | correlation | correlation | covariance | alpha | |
csr301 | 344 | + | 0.7081 | 0.4845 | .2581489 | 0.6877 |
csr302 | 344 | + | 0.6645 | 0.4139 | .2791333 | 0.7189 |
csr303 | 344 | + | 0.7135 | 0.5522 | .2707429 | 0.6654 |
csr304 | 344 | + | 0.6960 | 0.5028 | .2700282 | 0.6792 |
csr305 | 344 | + | 0.7090 | 0.5326 | .2678218 | 0.6695 |
Test scale | .269175 0.7300 | |||||
average item-test item-rest interitem
Obs | Sign | correlation | correlation | covariance | alpha | |
csr401 | 344 | + | 0.8081 | 0.4890 | .2381687 | 0.5621 |
csr402 | 344 | + | 0.8042 | 0.5379 | .2256255 | 0.4886 |
csr403 | 344 | + | 0.7090 | 0.4188 | .3607278 | 0.6439 |
Test scale | .2748407 0.6657 | |||||
average item-test item-rest interitem
Obs | Sign | correlation | correlation | covariance | alpha | |
csr501 | 344 | + | 0.8554 | 0.6564 | .3181911 | 0.6497 |
csr502 | 344 | + | 0.8510 | 0.6445 | .325039 | 0.6631 |
csr503 | 344 | + | 0.7867 | 0.5416 | .4333345 | 0.7732 |
Test scale | .3588548 0.7769 | |||||
average item-test item-rest interitem
Obs | Sign | correlation | correlation | covariance | alpha | |
ebbe01 | 344 | + | 0.7470 | 0.6552 | .4890965 | 0.8828 |
ebbe02 | 344 | + | 0.7794 | 0.7089 | .4959037 | 0.8783 |
ebbe03 | 344 | + | 0.7419 | 0.6583 | .5009214 | 0.8825 |
ebbe04 | 344 | + | 0.8257 | 0.7634 | .4762466 | 0.8727 |
ebbe05 | 344 | + | 0.7483 | 0.6634 | .495867 | 0.8819 |
ebbe06 | 344 | + | 0.7311 | 0.6400 | .4987513 | 0.8841 |
ebbe07 | 344 | + | 0.7098 | 0.6093 | .5008826 | 0.8872 |
ebbe08 | 344 | + | 0.7954 | 0.7068 | .4613158 | 0.8783 |
Test scale | .4898731 0.8943 | |||||
5. Kết quả phân tích nhân tố EFA cho khái niệm Trách nhiệm xã hội và Giá trị thương hiệu – Nhóm nhân viên
Number of obs = | 344 | |
Method: principal-component factors | Retained factors = | 5 |
Rotation: (unrotated) | Number of params = | 100 |
Eigenvalue | Difference | Proportion | Cumulative | |
Factor1 | 7.00030 | 3.83670 | 0.3182 | 0.3182 |
Factor2 | 3.16360 | 1.60324 | 0.1438 | 0.4620 |
Factor3 | 1.56036 | 0.22365 | 0.0709 | 0.5329 |
Factor4 | 1.33671 | 0.30962 | 0.0608 | 0.5937 |
Factor5 | 1.02709 | 0.16529 | 0.0467 | 0.6404 |
Factor6 | 0.86180 | 0.08873 | 0.0392 | 0.6795 |
Factor7 | 0.77308 | 0.08114 | 0.0351 | 0.7147 |
Factor8 | 0.69194 | 0.05081 | 0.0315 | 0.7461 |
Factor9 | 0.64113 | 0.09182 | 0.0291 | 0.7753 |
Factor10 | 0.54931 | 0.05832 | 0.0250 | 0.8002 |
Factor11 | 0.49099 | 0.01432 | 0.0223 | 0.8226 |
Factor12 | 0.47667 | 0.03558 | 0.0217 | 0.8442 |
Factor13 | 0.44109 | 0.01751 | 0.0200 | 0.8643 |
Factor14 | 0.42358 | 0.02040 | 0.0193 | 0.8835 |
Factor15 | 0.40318 | 0.03695 | 0.0183 | 0.9019 |
Factor16 | 0.36623 | 0.01995 | 0.0166 | 0.9185 |
Factor17 | 0.34628 | 0.00752 | 0.0157 | 0.9342 |
Factor18 | 0.33877 | 0.02315 | 0.0154 | 0.9496 |
Factor19 | 0.31562 | 0.03096 | 0.0143 | 0.9640 |
Factor20 | 0.28465 | 0.00827 | 0.0129 | 0.9769 |
Factor21 | 0.27639 | 0.04516 | 0.0126 | 0.9895 |
Factor22 | 0.23123 | . | 0.0105 | 1.0000 |
LR test: independent vs. saturated: chi2(231) = 3460.45 Prob>chi2 = 0.0000
Kaiser-Meyer-Olkin measure of sampling adequacy
kmo | |
csr101 | 0.8200 |
csr102 | 0.8020 |
csr103 | 0.8529 |
csr104 | 0.8338 |
csr105 | 0.9067 |
csr201 | 0.9064 |
csr202 | 0.9364 |
csr203 | 0.9205 |
csr204 | 0.9300 |
csr205 | 0.9192 |
csr206 | 0.9347 |
csr301 | 0.9232 |
csr302 | 0.9240 |
csr303 | 0.9102 |
csr304 | 0.8702 |
csr305 | 0.8932 |
csr401 | 0.8694 |
csr402 | 0.8782 |
csr403 | 0.8811 |
csr501 | 0.8820 |
csr502 | 0.8859 |
csr503 | 0.9364 |
Overall | 0.8968 |
Rotated factor loadings (pattern matrix) and unique variances
Factor1 | Factor2 | Factor3 | Factor4 | Factor5 | Uniqueness | |
csr101 | 0.8050 | 0.3273 | ||||
csr102 | 0.7476 | 0.4105 | ||||
csr103 | 0.7714 | 0.3544 | ||||
csr104 | 0.8118 | 0.3073 | ||||
csr105 | 0.6347 | 0.4968 | ||||
csr201 | 0.8410 | 0.2496 | ||||
csr202 | 0.7782 | 0.3102 | ||||
csr203 | 0.8234 | 0.2929 | ||||
csr204 | 0.7529 | 0.3353 | ||||
csr205 | 0.7668 | 0.3643 | ||||
csr206 | 0.7843 | 0.2996 | ||||
csr301 | 0.5749 | |||||
csr302 | 0.7090 | 0.3601 | ||||
csr303 | 0.6318 | 0.4503 | ||||
csr304 | 0.7894 | 0.3157 | ||||
csr305 | 0.6872 | 0.3752 | ||||
csr401 | 0.7748 | 0.3260 | ||||
csr402 | 0.7807 | 0.3131 | ||||
csr403 | 0.5459 | 0.4569 | ||||
csr501 | 0.8064 | 0.2911 | ||||
csr502 | 0.8119 | 0.2670 | ||||
csr503 | 0.5509 | 0.4336 |
(blanks represent abs(loading)<.5)
Number of obs = | 344 | |
Method: principal-component factors | Retained factors = | 1 |
Rotation: (unrotated) | Number of params = | 8 |
Eigenvalue | Difference | Proportion | Cumulative | |
Factor1 | 4.63390 | 3.73806 | 0.5792 | 0.5792 |
Factor2 | 0.89584 | 0.30335 | 0.1120 | 0.6912 |
Factor3 | 0.59249 | 0.12121 | 0.0741 | 0.7653 |
Factor4 | 0.47128 | 0.02336 | 0.0589 | 0.8242 |
Factor5 | 0.44792 | 0.06620 | 0.0560 | 0.8802 |
Factor6 | 0.38172 | 0.05986 | 0.0477 | 0.9279 |
Factor7 | 0.32185 | 0.06685 | 0.0402 | 0.9681 |
Factor8 | 0.25500 | . | 0.0319 | 1.0000 |
LR test: independent vs. saturated: chi2(28) = 1402.41 Prob>chi2 = 0.0000
Kaiser-Meyer-Olkin measure of sampling adequacy
kmo | |
ebbe01 | 0.9360 |
ebbe02 | 0.8966 |
ebbe03 | 0.9291 |
ebbe04 | 0.8866 |
ebbe05 | 0.9367 |
ebbe06 | 0.8513 |
ebbe07 | 0.9285 |
ebbe08 | 0.8647 |
Overall | 0.9014 |
average item-test item-rest interitem
Obs | Sign | correlation | correlation | covariance | alpha | |
csr303 | 344 | + | 0.7347 | 0.4484 | .3812886 | 0.7178 |
csr304 | 344 | + | 0.8360 | 0.5853 | .2336091 | 0.5531 |
csr305 | 344 | + | 0.8168 | 0.5675 | .2615432 | 0.5777 |
Test scale | .2921469 0.7127 | |||||
average item-test item-rest interitem
Obs | Sign | correlation | correlation | covariance | alpha | |
csr302 | 344 | + | 0.8292 | 0.6472 | .3588548 | 0.7769 |
csr501 | 344 | + | 0.8057 | 0.6516 | .4032138 | 0.7698 |
csr502 | 344 | + | 0.8302 | 0.6895 | .382896 | 0.7524 |
csr503 | 344 | + | 0.7647 | 0.5970 | .4400129 | 0.7941 |
Test scale | .3962444 0.8201 | |||||
6. Kết quả phân tích nhân tố khẳng định CFA nhóm nhân viên
Value | Description | |
Likelihood ratio chi2_ms(413) p > chi2 chi2_bs(465) p > chi2 | 1011.706 | model vs. saturated |
0.000 | ||
6639.656 | baseline vs. saturated | |
0.000 | ||
Population error RMSEA 90% CI, lower bound upper bound pclose | 0.065 | Root mean squared error of approximation |
0.060 | ||
0.070 | ||
0.000 | Probability RMSEA <= 0.05 | |
Information criteria | ||
AIC | 23644.741 | Akaike's information criterion |
BIC | 24082.574 | Bayesian information criterion |
Baseline comparison | ||
CFI | 0.903 | Comparative fit index |
TLI | 0.891 | Tucker-Lewis index |
Size of residuals SRMR | 0.054 | Standardized root mean squared residual |
7. Kết quả phân tích SEM nhóm nhân viên
Structural equation model Number of obs = 344
Estimation method = ml
Log likelihood = -11647.913
( 1) [roa2017]FPER = 1
( 2) [ebbe01]EBBE = 1
( 3) [csr101]CSRCom = 1
( 4) [csr201]CSREmp = 1
( 5) [csr303]CSRCus = 1
( 6) [csr401]CSRSha = 1
( 7) [csr302]CSROth = 1
Coef. | OIM Std. Err. | z | P>|z| | [95% Conf. | Interval] | |||
Structural | ||||||||
FPER <- | ||||||||
EBBE | .4248473 | .0687247 | 6.18 | 0.000 | .2901494 | .5595451 | ||
CSRCom | -.0605672 | .0461217 | -1.31 | 0.189 | -.150964 | .0298296 | ||
CSREmp | .2214039 | .0380419 | 5.82 | 0.000 | .1468432 | .2959646 | ||
CSRCus | .275264 | .0932588 | 2.95 | 0.003 | .09248 | .458048 | ||
CSRSha | -.1363619 | .060042 | -2.27 | 0.023 | -.2540422 | -.0186817 | ||
CSROth | -.0273465 | .0546488 | -0.50 | 0.617 | -.1344562 | .0797631 | ||
EBBE <- | ||||||||
CSRCom | .0324517 | .0719306 | 0.45 | 0.652 | -.1085298 | .1734332 | ||
CSREmp | .3591898 | .0518062 | 6.93 | 0.000 | .2576515 | .4607282 | ||
CSRCus | -.1382609 | .136475 | -1.01 | 0.311 | -.405747 | .1292252 | ||
CSRSha | .1706949 | .0884142 | 1.93 | 0.054 | -.0025938 | .3439836 | ||
CSROth | .4742574 | .072334 | 6.56 | 0.000 | .3324854 | .6160295 | ||
Value | Description | |
Likelihood ratio chi2_ms(412) p > chi2 chi2_bs(465) p > chi2 | 890.792 | model vs. saturated |
0.000 | ||
6639.656 | baseline vs. saturated | |
0.000 | ||
Population error RMSEA 90% CI, lower bound upper bound pclose | 0.058 | Root mean squared error of approximation |
0.053 | ||
0.063 | ||
0.006 | Probability RMSEA <= 0.05 | |
Information criteria | ||
AIC | 23525.826 | Akaike's information criterion |
BIC | 23967.500 | Bayesian information criterion |
Baseline comparison | ||
CFI | 0.922 | Comparative fit index |
TLI | 0.912 | Tucker-Lewis index |
Size of residuals SRMR | 0.065 | Standardized root mean squared residual |
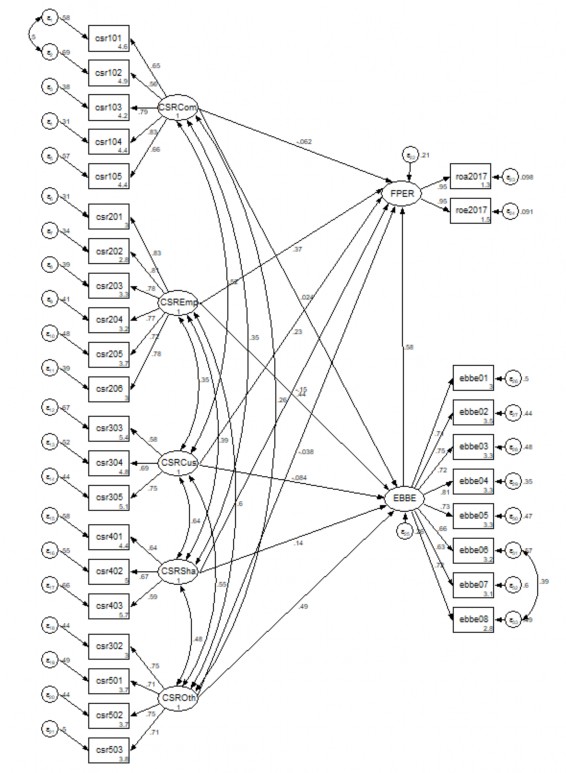
8. MÔ HÌNH SEM NHÓM NHÂN VIÊN
9. KIỂM ĐỊNH BOOTSTRAP NHÓM NHÂN VIÊN QUẢN LÝ
Number of obs | = | 344 | |
Log likelihood = -11647.913 | Replications | = | 1,000 |
( 1) [roa2017]FPER = 1
( 2) [ebbe01]EBBE = 1
( 3) [csr101]CSRCom = 1
( 4) [csr201]CSREmp = 1
( 5) [csr303]CSRCus = 1
( 6) [csr401]CSRSha = 1
( 7) [csr302]CSROth = 1
( 8) [cov(CSRCom,CSREmp)]_cons = 0
Observed Coef. | Bootstrap Std. Err. | z | P>|z| | Normal-based [95% Conf. Interval] | ||||
Structural | ||||||||
FPER <- | ||||||||
EBBE | .4248473 | .0801825 | 5.30 | 0.000 | .2676926 | .582002 | ||
CSRCom | -.0605672 | .0500773 | -1.21 | 0.226 | -.1587169 | .0375825 | ||
CSREmp | .2214039 | .0389796 | 5.68 | 0.000 | .1450052 | .2978025 | ||
CSRCus | .275264 | .1094636 | 2.51 | 0.012 | .0607193 | .4898087 | ||
CSRSha | -.1363619 | .0703704 | -1.94 | 0.053 | -.2742854 | .0015616 | ||
CSROth | -.0273465 | .0642637 | -0.43 | 0.670 | -.153301 | .098608 | ||
EBBE <- | ||||||||
CSRCom | .0324517 | .0684583 | 0.47 | 0.635 | -.1017241 | .1666274 | ||
CSREmp | .3591898 | .061278 | 5.86 | 0.000 | .2390872 | .4792925 | ||
CSRCus | -.1382609 | .1435608 | -0.96 | 0.336 | -.4196349 | .1431131 | ||
CSRSha | .1706949 | .0962568 | 1.77 | 0.076 | -.0179649 | .3593547 | ||
CSROth | .4742574 | .0803289 | 5.90 | 0.000 | .3168157 | .6316991 | ||
10. PHÂN TÍCH ĐA NHÓM NHÂN VIÊN VÀ QUẢN LÝ
Coef. | OIM Std. Err. | z | P>|z| | [95% Conf. | Interval] | |||
Structural | ||||||||
FPER <- | ||||||||
EBBE | ||||||||
1 | .3366475 | .1580455 | 2.13 | 0.033 | .026884 | .6464111 | ||
2 | .4396069 | .0782618 | 5.62 | 0.000 | .2862166 | .5929973 | ||
CSRCom | ||||||||
1 | -.0504626 | .0806972 | -0.63 | 0.532 | -.2086263 | .107701 | ||
2 | -.0464103 | .0575597 | -0.81 | 0.420 | -.1592253 | .0664047 | ||
CSREmp | ||||||||
1 | .1918674 | .059281 | 3.24 | 0.001 | .0756787 | .3080561 | ||
2 | .2439135 | .0504437 | 4.84 | 0.000 | .1450457 | .3427813 | ||
CSRCus | ||||||||
1 | .3275522 | .4242176 | 0.77 | 0.440 | -.5038989 | 1.159003 | ||
2 | .2808577 | .0953295 | 2.95 | 0.003 | .0940153 | .4677 | ||
CSRSha | ||||||||
1 | -.0526252 | .1324168 | -0.40 | 0.691 | -.3121574 | .2069069 | ||
2 | -.2306594 | .089819 | -2.57 | 0.010 | -.4067013 | -.0546175 | ||
CSROth | ||||||||
1 | -.0177291 | .279615 | -0.06 | 0.949 | -.5657644 | .5303062 | ||
2 | -.0074692 | .0536 | -0.14 | 0.889 | -.1125234 | .0975849 | ||
EBBE <- | ||||||||
CSRCom | ||||||||
1 | -.0659556 | .161872 | -0.41 | 0.684 | -.383219 | .2513077 | ||
2 | .075225 | .0876644 | 0.86 | 0.391 | -.0965942 | .2470441 | ||
CSREmp | ||||||||
1 | .3155372 | .1474473 | 2.14 | 0.032 | .0265458 | .6045287 | ||
2 | .4439287 | .0635246 | 6.99 | 0.000 | .3194227 | .5684347 | ||
CSRCus | ||||||||
1 | 1.292111 | 1.258007 | 1.03 | 0.304 | -1.173537 | 3.757759 | ||
2 | -.1468927 | .1368725 | -1.07 | 0.283 | -.415158 | .1213725 | ||
CSRSha | ||||||||
1 | -.2548871 | .3499461 | -0.73 | 0.466 | -.9407689 | .4309947 | ||
2 | .2033155 | .122602 | 1.66 | 0.097 | -.03698 | .443611 | ||
CSROth | ||||||||
1 | -.014907 | .6703295 | -0.02 | 0.982 | -1.328729 | 1.298915 | ||
2 | .3828518 | .0721042 | 5.31 | 0.000 | .2415301 | .5241735 | ||