KMO and Bartlett's Test
.878 | |
Approx. Chi-Square | 3088.116 |
Bartlett's Test of Sphericity df | 210 |
Sig. | .000 |
Có thể bạn quan tâm!
-

 Những Hạn Chế Và Hướng Nghiên Cứu Tiếp Theo
 -
 Ang, S., And Van Dyne, L. (Eds.). (2008). “ Hanbook Of Cultural Intelligence, Armonk, Ny: M.e Sharpe”.
 -
 Nghiên cứu các yếu tố văn hoá doanh nghiệp tác động đến sự gắn kết với doanh nghiệp của nhân viên tại các khách sạn 4 sao tại thành phố Hồ Chí Minh - 13
Xem toàn bộ 112 trang tài liệu này.
Total Variance Explained
Initial Eigenvalues | Extraction Sums of Squared Loadings | Rotation Sums of Squared Loadings | |||||||
Total | % of Variance | Cumulati ve % | Total | % of Variance | Cumulative % | Total | % of Variance | Cumulative % | |
1 | 7.44 2 | 35.440 | 35.440 | 7.442 | 35.440 | 35.440 | 3.58 2 | 17.059 | 17.059 |
2 | 2.64 1 | 12.578 | 48.018 | 2.641 | 12.578 | 48.018 | 3.13 0 | 14.904 | 31.964 |
3 | 2.16 9 | 10.329 | 58.346 | 2.169 | 10.329 | 58.346 | 2.87 6 | 13.695 | 45.658 |
4 | 1.28 4 | 6.113 | 64.459 | 1.284 | 6.113 | 64.459 | 2.62 8 | 12.512 | 58.171 |
5 | 1.25 6 | 5.980 | 70.439 | 1.256 | 5.980 | 70.439 | 2.57 6 | 12.268 | 70.439 |
6 | .752 | 3.580 | 74.019 | ||||||
7 | .611 | 2.910 | 76.928 | ||||||
8 | .582 | 2.773 | 79.701 | ||||||
9 | .491 | 2.339 | 82.040 | ||||||
10 | .481 | 2.291 | 84.331 | ||||||
11 | .451 | 2.146 | 86.477 | ||||||
12 | .413 | 1.967 | 88.444 | ||||||
13 | .406 | 1.935 | 90.379 |
.351 | 1.671 | 92.050 | |
15 | .323 | 1.537 | 93.587 |
16 | .281 | 1.337 | 94.924 |
17 | .255 | 1.215 | 96.139 |
18 | .232 | 1.106 | 97.246 |
19 | .218 | 1.040 | 98.286 |
20 | .195 | .928 | 99.214 |
21 | .165 | .786 | 100.000 |
Extraction Method: Principal Component Analysis.
Rotated Component Matrixa
Component | |||||
1 | 2 | 3 | 4 | 5 | |
PTCN2 | .825 | ||||
PTCN3 | .790 | ||||
PTCN4 | .773 | ||||
PTCN1 | .753 | ||||
PTCN5 | .708 | ||||
DTPT3 | .873 | ||||
DTPT4 | .859 | ||||
DTPT2 | .829 | ||||
DTPT1 | .745 | ||||
LVN4 | .836 | ||||
LVN3 | .817 | ||||
LVN1 | .768 | ||||
LVN2 | .635 | ||||
GTTTC1 | .807 | ||||
GTTTC3 | .801 | ||||
GTTTC2 | .739 | ||||
GTTTC4 | .620 | ||||
SCB1 | .808 | ||||
SCB3 | .804 | ||||
SCB2 | .713 | ||||
SCB4 | .700 |
Extraction Method: Principal Component Analysis. Rotation Method: Varimax with Kaiser Normalization.
a. Rotation converged in 5 iterations.
KMO and Bartlett's Test
.738 | |
Approx. Chi-Square | 417.802 |
Bartlett's Test of Sphericity df | 3 |
Sig. | .000 |
Total Variance Explained
Initial Eigenvalues | Extraction Sums of Squared Loadings | |||||
Total | % of Variance | Cumulative % | Total | % of Variance | Cumulative % | |
1 | 2.425 | 80.841 | 80.841 | 2.425 | 80.841 | 80.841 |
2 | .331 | 11.026 | 91.867 | |||
3 | .244 | 8.133 | 100.000 |
Extraction Method: Principal Component Analysis.
Component Matrixa
Component | |
1 | |
SGK2 SGK3 SGK1 | .915 .899 .883 |
Extraction Method: Principal Component Analysis.
a. 1 components extracted.
Correlations
GTTTC | DTPT | PTCN | LVN | SCB | SGK | |
Pearson Correlation | 1 | .371** | .372** | .579** | .354** | .692** |
GTTTC Sig. (2-tailed) | .000 | .000 | .000 | .000 | .000 | |
N | 259 | 259 | 259 | 259 | 259 | 259 |
Pearson Correlation | .371** | 1 | .493** | .396** | .079 | .480** |
DTPT Sig. (2-tailed) | .000 | .000 | .000 | .203 | .000 | |
N | 259 | 259 | 259 | 259 | 259 | 259 |
Pearson Correlation | .372** | .493** | 1 | .400** | .360** | .531** |
PTCN Sig. (2-tailed) | .000 | .000 | .000 | .000 | .000 | |
N | 259 | 259 | 259 | 259 | 259 | 259 |
Pearson Correlation | .579** | .396** | .400** | 1 | .358** | .668** |
LVN Sig. (2-tailed) | .000 | .000 | .000 | .000 | .000 | |
N | 259 | 259 | 259 | 259 | 259 | 259 |
Pearson Correlation | .354** | .079 | .360** | .358** | 1 | .389** |
SCB Sig. (2-tailed) | .000 | .203 | .000 | .000 | .000 | |
N | 259 | 259 | 259 | 259 | 259 | 259 |
Pearson Correlation | .692** | .480** | .531** | .668** | .389** | 1 |
SGK Sig. (2-tailed) | .000 | .000 | .000 | .000 | .000 | |
N | 259 | 259 | 259 | 259 | 259 | 259 |
**. Correlation is significant at the 0.01 level (2-tailed).
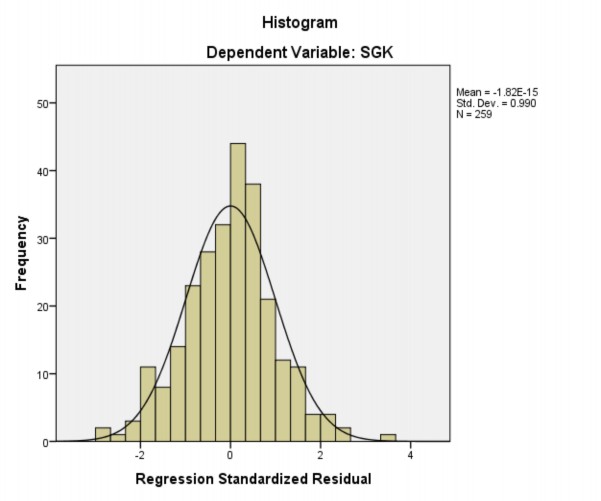
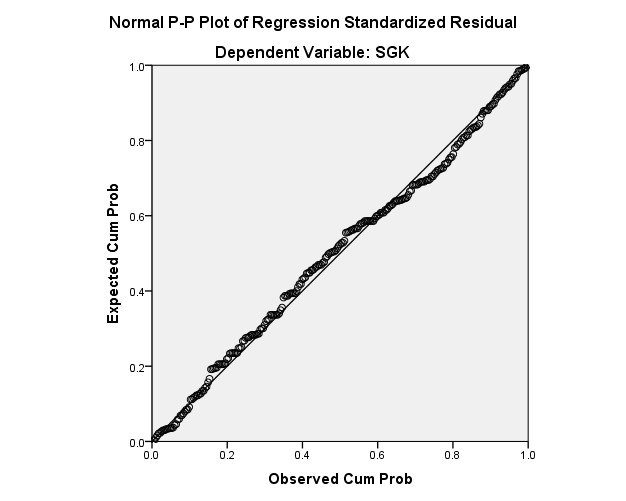
Model Summaryb
R | R Square | Adjusted R Square | Std. Error of the Estimate | Durbin-Watson | |
1 | .805a | .648 | .641 | .75837 | .479 |
a. Predictors: (Constant), SCB, DTPT, GTTTC, PTCN, LVN
b. Dependent Variable: SGK
ANOVAa
Sum of Squares | df | Mean Square | F | Sig. | ||
Regression | 267.827 | 5 | 53.565 | 93.138 | .000b | |
1 | Residual | 145.505 | 253 | .575 | ||
Total | 413.332 | 258 |
a. Dependent Variable: SGK
b. Predictors: (Constant), SCB, DTPT, GTTTC, PTCN, LVN
Coefficientsa
Unstandardized Coefficients | Standardized Coefficients | t | Sig. | Collinearity Statistics | ||||
B | Std. Error | Beta | Tolerance | VIF | ||||
(Constant) | -.577 | .229 | -2.518 | .012 | ||||
GTTTC | .445 | .056 | .379 | 7.927 | .000 | .610 | 1.640 | |
1 | DTPT PTCN | .172 .203 | .063 .052 | .125 .183 | 2.725 3.921 | .007 .000 | .665 .638 | 1.504 1.569 |
LVN | .344 | .056 | .301 | 6.192 | .000 | .589 | 1.697 | |
SCB | .076 | .046 | .071 | 1.659 | .038 | .758 | 1.318 |
a. Dependent Variable: SGK