Rotated Component Matrixa
Component | ||||
1 | 2 | 3 | 4 | |
DDTC7 | .897 | |||
DDTC6 | .891 | |||
DDTC8 | .886 | |||
DDTC4 | .865 | |||
DDTC2 | .809 | |||
DDTC1 | .792 | |||
DDTC3 | .690 | |||
DDTC5 | .662 | |||
CNNLD6 | .920 | |||
CNNLD3 | .913 | |||
CNNLD4 | .893 | |||
CNNLD2 | .888 | |||
CNNLD1 | .848 | |||
CNNLD5 | .833 | |||
DDCV2 | .921 | |||
DDCV4 | .913 | |||
DDCV1 | .757 | |||
DDCV3 | .724 | |||
DDCV5 | ||||
MTBN1 | .892 | |||
MTBN4 | .841 | |||
MTBN3 | .819 | |||
MTBN2 | .817 |
Có thể bạn quan tâm!
-
 Giải Pháp Nâng Cao Hiệu Quả Tạo Động Lực Cho Người Lao Động Qua Các Yếu Tố Thuộc Môi Trường Bên Ngoài
 -
 Giải pháp nhằm nâng cao hiệu quả tạo động lực cho người lao động tại nhà hàng Le Champa – Resort & Spa Le Belhamy - 14
 -
 Giải pháp nhằm nâng cao hiệu quả tạo động lực cho người lao động tại nhà hàng Le Champa – Resort & Spa Le Belhamy - 15
Xem toàn bộ 129 trang tài liệu này.
Extraction Method: Principal Component Analysis. Rotation Method: Varimax with Kaiser Normalization.
a. Rotation converged in 5 iterations.
Kaiser-Meyer-Olkin Measure of Sampling Adequacy. | .723 | |
Approx. Chi-Square | 214.793 | |
Bartlett's Test of Sphericity | Df | 6 |
Sig. | .000 | |
Total Variance Explained
Initial Eigenvalues | Extraction Sums of Squared Loadings | |||||
Total | % of Variance | Cumulative % | Total | % of Variance | Cumulative % | |
1 | 2.462 | 61.547 | 61.547 | 2.462 | 61.547 | 61.547 |
2 | .735 | 18.372 | 79.919 | |||
3 | .495 | 12.381 | 92.300 | |||
4 | .308 | 7.700 | 100.000 |
Extraction Method: Principal Component Analysis.
Component Matrixa
Component | |
1 | |
DLLV1 | .867 |
DLLV3 | .783 |
DLLV2 | .762 |
DLLV4 | .719 |
Extraction Method: Principal Component Analysis.
a. 1 components extracted.
PHỤ LỤC 07
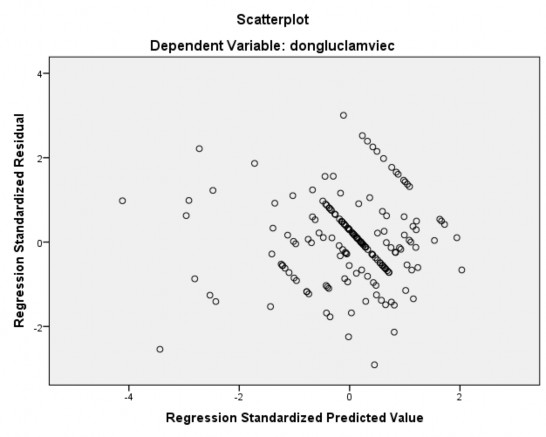
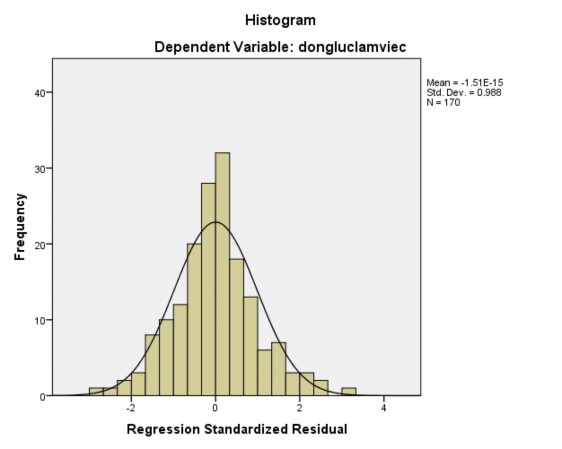
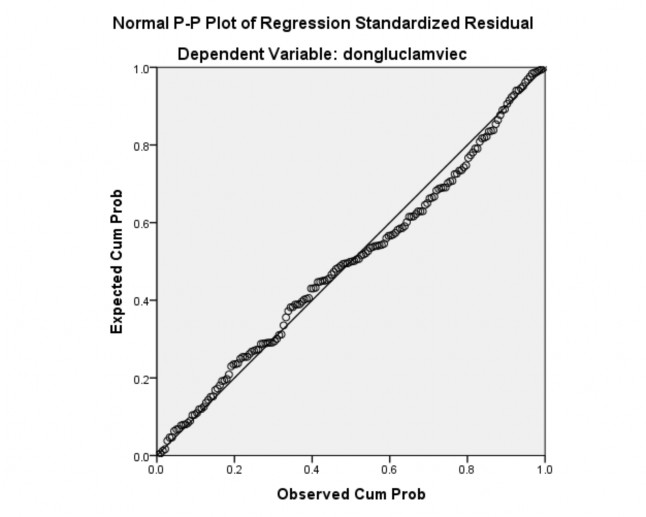
ĐỒ THỊ TÁN PHẦN DƯ CHUẨN HÓA


PHỤ LỤC 08
MA TRẬN TƯƠNG QUAN GIỮA CÁC BIẾN
Correlations
Dongluc lamviec | Canhannguoi laodong | Dacdiem congviec | Dacdiem tochuc | Moitruong benngoai | ||
Pearson Correlation | 1 | .139 | .447** | .774** | .106 | |
dongluclamviec | Sig. (2-tailed) | .071 | .000 | .000 | .171 | |
N | 170 | 170 | 170 | 170 | 170 | |
Pearson Correlation | .139 | 1 | -.171* | -.004 | .205** | |
canhannguoilaodong | Sig. (2-tailed) | .071 | .026 | .963 | .007 | |
N | 170 | 170 | 170 | 170 | 170 | |
Pearson Correlation | .447** | -.171* | 1 | .402** | -.121 | |
dacdiemcongviec | Sig. (2-tailed) | .000 | .026 | .000 | .116 | |
N | 170 | 170 | 170 | 170 | 170 | |
Pearson Correlation | .774** | -.004 | .402** | 1 | -.067 | |
dacdiemtochuc | Sig. (2-tailed) | .000 | .963 | .000 | .388 | |
N | 170 | 170 | 170 | 170 | 170 | |
moitruongbenngoai | Pearson Correlation | .106 | .205** | -.121 | -.067 | 1 |
Sig. (2-tailed) | .171 | .007 | .116 | .388 |
170 | 170 | 170 | 170 | 170 |
*. Correlation is significant at the 0.05 level (2-tailed). |
PHỤ LỤC 09
XÂY DỰNG MÔ HÌNH HÔI QUY TUYẾN TÍNH
Model Summaryb
R | R Square | Adjusted R Square | Std. Error of the Estimate | Change Statistics | Durbin- Watson | |||||
R Square Change | F Change | df1 | df2 | Sig. F Change | ||||||
1 | .819a | .671 | .663 | .39048 | .671 | 84.233 | 4 | 165 | .000 | 1.813 |
a. Predictors: (Constant), moitruongbenngoai, dacdiemtochuc, canhannguoilaodong, dacdiemcongviec
b. Dependent Variable: dongluclamviec
Coefficientsa
Unstandardized Coefficients | Standardized Coefficients | t | Sig. | Collinearity Statistics | ||||
B | Std. Error | Beta | Tolerance | VIF | ||||
(Constant) | -.025 | .253 | -.099 | .921 | ||||
canhannguoilaodong | .105 | .033 | .147 | 3.167 | .002 | .931 | 1.075 | |
1 | dacdiemcongviec | .202 | .048 | .208 | 4.192 | .000 | .806 | 1.240 |
dacdiemtochuc | .638 | .045 | .701 | 14.328 | .000 | .833 | 1.200 | |
moitruongbenngoai | .089 | .028 | .147 | 3.216 | .002 | .949 | 1.054 |
a. Dependent Variable: dongluclamviec
25
PHỤ LỤC 10 KIỂM ĐỊNH ANOVA
ANOVAa
Sum of Squares | df | Mean Square | F | Sig. | ||
Regression | 51.373 | 4 | 12.843 | 84.233 | .000b | |
1 | Residual | 25.158 | 165 | .152 | ||
Total | 76.531 | 169 |
a. Dependent Variable: dongluclamviec
b. Predictors: (Constant), moitruongbenngoai, dacdiemtochuc, canhannguoilaodong, dacdiemcongviec


