.854 | |||||
HINHANH2 | .793 | ||||
HINHANH1 | .758 | ||||
HINHANH3 | .723 | ||||
Extraction Method: Principal Component Analysis. Rotation Method: Varimax with Kaiser Normalization. | |||||
a. Rotation converged in 6 iterations. | |||||
Có thể bạn quan tâm!
-

 Danh Sách Các Đơn Vị Lữ Hành Kinh Doanh Du Lịch
 -
 Phân Tích Đánh Giá Của Du Khách Về Các Thành Phần Của Các Yếu Tố Tạo Năng Lực Cạnh Tranh Trong Kinh Doanh Du Lịch
 -
 Giải pháp nâng cao năng lực cạnh tranh trong kinh doanh du lịch tại Tiền Giang - 24
 -
 Giải pháp nâng cao năng lực cạnh tranh trong kinh doanh du lịch tại Tiền Giang - 26
 -
 Giải pháp nâng cao năng lực cạnh tranh trong kinh doanh du lịch tại Tiền Giang - 27
Xem toàn bộ 219 trang tài liệu này.
7d) Kiểm định KMO thang đo năng lực cạnh tranh
Kaiser-Meyer-Olkin Measure of Sampling Adequacy. | .731 | |
Bartlett's Test of Sphericity | Approx. Chi-Square | 616.358 |
Df | 3 | |
Sig. | .000 | |
7e) Tổng phương sai trích thang đo năng lực cạnh tranh
Component | Initial Eigenvalues | Extraction Sums of Squared Loadings | ||||
Total | % of Variance | Cumulative % | Total | % of Variance | Cumulative % | |
1 | 2.422 | 80.729 | 80.729 | 2.422 | 80.729 | 80.729 |
2 | .353 | 11.754 | 92.484 | |||
3 | .225 | 7.516 | 100.000 | |||
Extraction Method: Principal Component Analysis. | ||||||
7f) EFA thang đo năng lực cạnh tranh
Component | |
1 | |
NANGLUC2 | .919 |
NANGLUC3 | .903 |
NANGLUC1 | .873 |
Extraction Method: Principal Component Analysis. | |
a. 1 components extracted. | |
7g) Ma trận hệ số tương quan
DIEMDE N | SPDV | HINH ANH | HOTRO | CHINH SACH | NANGLU C | ||
DIEMDEN | Pearson Correlation | 1 | .333** | .549** | .551** | .331** | .504** |
Sig. (2-tailed) | .000 | .000 | .000 | .000 | .000 | ||
N | 377 | 377 | 377 | 377 | 377 | 377 | |
SPDV | Pearson Correlation | .333** | 1 | .296** | .307** | .340** | .377** |
Sig. (2-tailed) | .000 | .000 | .000 | .000 | .000 | ||
N | 377 | 377 | 377 | 377 | 377 | 377 | |
HINHANH | Pearson Correlation | .549** | .296** | 1 | .556** | .297** | .534** |
Sig. (2-tailed) | .000 | .000 | .000 | .000 | .000 | ||
N | 377 | 377 | 377 | 377 | 377 | 377 | |
HOTRO | Pearson Correlation | .551** | .307** | .556** | 1 | .272** | .547** |
Sig. (2-tailed) | .000 | .000 | .000 | .000 | .000 | ||
N | 377 | 377 | 377 | 377 | 377 | 377 | |
CHINHSACH | Pearson Correlation | .331** | .340** | .297** | .272** | 1 | .350** |
Sig. (2-tailed) | .000 | .000 | .000 | .000 | .000 | ||
N | 377 | 377 | 377 | 377 | 377 | 377 | |
NANGLUC | Pearson Correlation | .504** | .377** | .534** | .547** | .350** | 1 |
Sig. (2-tailed) | .000 | .000 | .000 | .000 | .000 | ||
N | 377 | 377 | 377 | 377 | 377 | 377 | |
**. Correlation is significant at the 0.01 level (2- tailed). | |||||||
Phụ lục 8: Phân tích hồi quy bội Phương pháp ENTER
Model | Variables Entered | Variables Removed | Method |
1 | CHINHSACH, HOTRO, SPDV, CANHTRANH, DIEMDENa | . | Enter |
a. All requested variables entered. | |||
b. Dependent Variable: NANGLUC | |||
8a) Tóm tắt mô hình
Model | R | R Square | Adjusted R Square | Change Statistics | Durbin- Watson | ||||
R Square Change | F Change | df1 | df2 | Sig. F Change | |||||
1 | .718a | .515 | .508 | .508 | 56.984 | 5 | 371 | .000 | 1.966 |
a. Predictors: (Constant), CHINHSACH, HOTRO, SPDV, HINHANH, DIEMDEN | |||||||||
b. Dependent Variable: NANGLUC | |||||||||
8b) Phân tích Anova
Model | Sum of Squares | df | Mean Square | F | Sig. | |
1 | Regression | 106.716 | 5 | 21.343 | 56.984 | .000a |
Residual | 138.958 | 371 | .375 | |||
Total | 245.674 | 376 | ||||
a. Predictors: (Constant), CHINHSACH, HOTRO, SPDV, HINHANH, DIEMDEN | ||||||
b. Dependent Variable: NANGLUC | ||||||
8c) Hệ số thống kê
Model | Unstandardized Coefficients | Standardized Coefficients | t | Sig.* | Correlations | Collinearity Statistics | |||||
B | Std. Error | Beta | Zero- order | Partial | Part | Tolerance | VIF | ||||
1 | (Constant) | -.276 | .235 | - 1.171 | .242 | ||||||
DIEMDEN | .169 | .059 | .148 | 2.894 | .004 | .504 | .149 | .113 | .583 | 1.715 | |
SPDV | .149 | .046 | .139 | 3.214 | .001 | .377 | .165 | .125 | .811 | 1.233 | |
HINHANH | .303 | .066 | .232 | 4.580 | .000 | .534 | .231 | .179 | .596 | 1.678 | |
HOTRO | .336 | .065 | .263 | 5.198 | .000 | .547 | .261 | .203 | .596 | 1.679 | |
CHINHSACH | .144 | .055 | .113 | 2.628 | .009 | .350 | .135 | .103 | .819 | 1.221 | |
a. Dependent Variable: NANGLUC | |||||||||||
* Giá trị sig. (P.value) các biến độc lập đều < 0.05 nên ta có mô hình NĂNG LỰC CẠNH TRANH sau:
NANGLUC = HOTRO x 0.263 + HINHANH x 0.232+ DIEMDEN x 0.148 + SPDV x
0.139 + CHINHSACH x 0.113
Model | Dimension | Eigenvalue | Condi- tion Index | Variance Proportions | |||||
(Cons- tant) | DIEM DEN | SPDV | HINH ANH | HO TRO | CHINH SACH | ||||
1 | 1 | 5.861 | 1.000 | .00 | .00 | .00 | .00 | .00 | .00 |
2 | .064 | 9.553 | .02 | .01 | .95 | .01 | .01 | .00 | |
3 | .034 | 13.226 | .00 | .04 | .03 | .02 | .03 | .92 | |
4 | .018 | 18.029 | .37 | .69 | .01 | .01 | .01 | .03 | |
5 | .012 | 22.152 | .54 | .23 | .00 | .04 | .61 | .04 | |
6 | .011 | 22.748 | .08 | .03 | .00 | .91 | .34 | .00 | |
a. Dependent Variable: NANGLUC | |||||||||
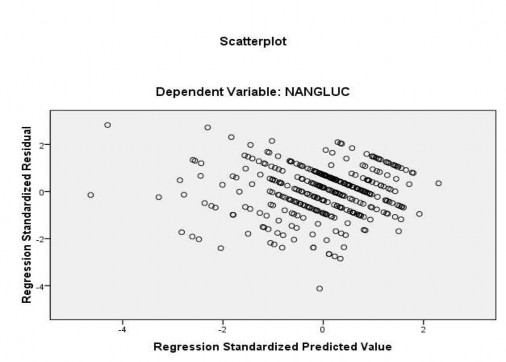
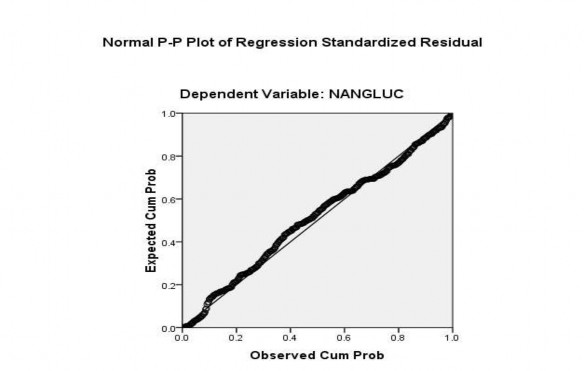
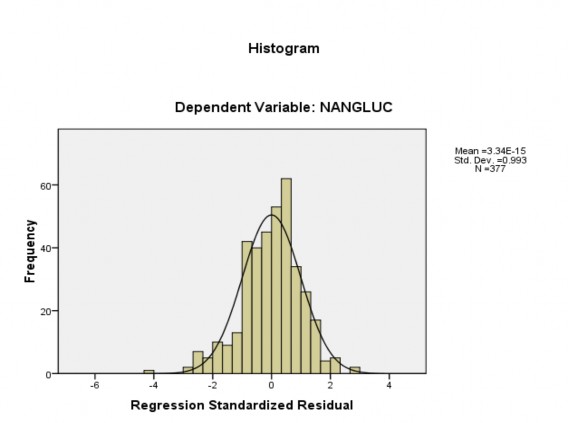
Phụ lục 9: Dò tìm vi phạm
9a) Đồ thị phân tán phần dư chuẩn hóa và giá trị dự đoán chuẩn hóa
9b) Biểu đồ P – PLot
9c) Biểu đồ tần số của phần dư chuẩn hóa
Phụ lục 10: Phân tích phương sai – ANOVA
Sum of Squares | df | Mean Square | F | Sig. | ||
DIEMDEN | Between Groups | 49.970 | 11 | 4.543 | 12.071 | .000 |
Within Groups | 137.364 | 365 | .376 | |||
Total | 187.334 | 376 | ||||
SPDV | Between Groups | 35.821 | 11 | 3.256 | 6.685 | .000 |
Within Groups | 177.814 | 365 | .487 | |||
Total | 213.635 | 376 | ||||
HINHANH | Between Groups | 45.327 | 11 | 4.121 | 15.365 | .000 |
Within Groups | 97.887 | 365 | .268 | |||
Total | 143.215 | 376 | ||||
HOTRO | Between Groups | 51.089 | 11 | 4.644 | 17.098 | .000 |
Within Groups | 99.150 | 365 | .272 | |||
Total | 150.239 | 376 | ||||
CHINHSACH | Between Groups | 22.802 | 11 | 2.073 | 5.816 | .000 |
Within Groups | 130.083 | 365 | .356 | |||
Total | 152.885 | 376 |
10a) Phân tích phương sai một yếu tố – Giới tính
NANGLUC | ||||||||
N | Mean | Std. Deviation | Std. Error | 95% Confidence Interval for Mean | Minimum | Maximum | ||
Lower Bound | Upper Bound | |||||||
Nam | 184 | 3.5978261E0 | .74907438 | .05522250 | 3.4888714 | 3.7067807 | 1.00000 | 5.00000 |
Nu | 193 | 3.5284974E0 | .86161703 | .06202055 | 3.4061683 | 3.6508265 | 1.00000 | 5.00000 |
Total | 377 | 3.5623342E0 | .80832443 | .04163083 | 3.4804758 | 3.6441926 | 1.00000 | 5.00000 |
NANGLUC | |||
Levene Statistic | df1 | df2 | Sig. |
4.114 | 1 | 375 | .043 |
NANGLUC | |||||
Sum of Squares | df | Mean Square | F | Sig. | |
Between Groups | .453 | 1 | .453 | .692 | .406 |
Within Groups | 245.221 | 375 | .654 | ||
Total | 245.674 | 376 |
10b) Phân tích phương sai một yếu tố – Độ tuổi
NANGLUC | ||||||||
N | Mean | Std. Deviation | Std. Error | 95% Confidence Interval for Mean | Minimum | Maximum | ||
Lower Bound | Upper Bound | |||||||
Duoi 30 tuoi | 133 | 3.5513784E0 | .78393499 | .06797578 | 3.4169156 | 3.6858413 | 1.00000 | 5.00000 |
Tu 30 – 40 tuoi | 124 | 3.6129032E0 | .79336350 | .07124615 | 3.4718758 | 3.7539306 | 1.00000 | 5.00000 |
Tren 40 tuoi | 120 | 3.5222222E0 | .85310805 | .07787775 | 3.3680165 | 3.6764280 | 1.00000 | 5.00000 |
Total | 377 | 3.5623342E0 | .80832443 | .04163083 | 3.4804758 | 3.6441926 | 1.00000 | 5.00000 |
NANGLUC | |||
Levene Statistic | df1 | df2 | Sig. |
.865 | 2 | 374 | .422 |
NANGLUC | |||||
Sum of Squares | df | Mean Square | F | Sig. | |
Between Groups | .526 | 2 | .263 | .401 | .670 |
Within Groups | 245.148 | 374 | .655 | ||
Total | 245.674 | 376 |