PHỤ LỤC 9
KẾT QUẢ PHÂN TÍCH NHÂN TỐ KHÁM PHÁ CHO THANG ĐO CÁC THÀNH PHẦN CỦA HTKSNB LẦN 3
Factor Analysis
Kaiser-Meyer-Olkin Measure of Sampling Adequacy. | .815 | |
Approx. Chi-Square | 2787.495 | |
Bartlett's Test of Sphericity | df | 528 |
Sig. | .000 | |
Có thể bạn quan tâm!
-

 Các nhân tố kiểm soát nội bộ ảnh hưởng đến tính hữu hiệu của hoạt động kinh doanh tại các ngân hàng thương mại tại tỉnh Vĩnh Long - 15
 -
 Các nhân tố kiểm soát nội bộ ảnh hưởng đến tính hữu hiệu của hoạt động kinh doanh tại các ngân hàng thương mại tại tỉnh Vĩnh Long - 16
 -
 Các nhân tố kiểm soát nội bộ ảnh hưởng đến tính hữu hiệu của hoạt động kinh doanh tại các ngân hàng thương mại tại tỉnh Vĩnh Long - 17
 -
 Các nhân tố kiểm soát nội bộ ảnh hưởng đến tính hữu hiệu của hoạt động kinh doanh tại các ngân hàng thương mại tại tỉnh Vĩnh Long - 19
Xem toàn bộ 159 trang tài liệu này.
Total Variance Explained
Initial Eigenvalues | Extraction Sums of Squared Loadings | Rotation Sums of Squared Loadings | |||||||
Total | % of Variance | Cumulative % | Total | % of Variance | Cumulative % | Total | % of Variance | Cumulative % | |
1 | 4.763 | 14.433 | 14.433 | 4.763 | 14.433 | 14.433 | 3.902 | 11.823 | 11.823 |
2 | 4.003 | 12.129 | 26.562 | 4.003 | 12.129 | 26.562 | 3.813 | 11.553 | 23.377 |
3 | 3.797 | 11.507 | 38.069 | 3.797 | 11.507 | 38.069 | 3.736 | 11.321 | 34.697 |
4 | 3.187 | 9.658 | 47.727 | 3.187 | 9.658 | 47.727 | 3.670 | 11.121 | 45.818 |
5 | 2.522 | 7.644 | 55.371 | 2.522 | 7.644 | 55.371 | 3.152 | 9.553 | 55.371 |
6 | .980 | 2.968 | 58.339 | ||||||
7 | .959 | 2.906 | 61.245 | ||||||
8 | .877 | 2.657 | 63.902 | ||||||
9 | .854 | 2.588 | 66.490 | ||||||
10 | .803 | 2.434 | 68.924 | ||||||
11 | .726 | 2.200 | 71.124 | ||||||
12 | .704 | 2.134 | 73.258 | ||||||
13 | .661 | 2.002 | 75.260 | ||||||
14 | .632 | 1.916 | 77.176 | ||||||
15 | .581 | 1.761 | 78.937 | ||||||
16 | .548 | 1.661 | 80.598 | ||||||
17 | .540 | 1.637 | 82.236 | ||||||
18 | .514 | 1.558 | 83.793 |
.510 | 1.545 | 85.338 | |||||||
20 | .485 | 1.471 | 86.809 | ||||||
21 | .447 | 1.354 | 88.163 | ||||||
22 | .440 | 1.334 | 89.497 | ||||||
23 | .416 | 1.262 | 90.759 | ||||||
24 | .396 | 1.199 | 91.958 | ||||||
25 | .380 | 1.152 | 93.109 | ||||||
26 | .377 | 1.143 | 94.252 | ||||||
27 | .343 | 1.038 | 95.291 | ||||||
28 | .334 | 1.012 | 96.302 | ||||||
29 | .289 | .877 | 97.179 | ||||||
30 | .267 | .808 | 97.987 | ||||||
31 | .247 | .747 | 98.734 | ||||||
32 | .224 | .680 | 99.414 | ||||||
33 | .193 | .586 | 100.000 |
Extraction Method: Principal Component Analysis. Extraction Method: Principal Component Analysis.
Rotated Component Matrixa
Component | |||||
1 | 2 | 3 | 4 | 5 | |
KS5 | .825 | ||||
KS6 | .775 | ||||
KS1 | .710 | ||||
KS4 | .687 | ||||
KS8 | .671 | ||||
KS2 | .615 | ||||
KS9 | .560 | ||||
KS3 | .560 | ||||
MT2 | .829 | ||||
MT7 | .783 | ||||
MT4 | .781 | ||||
MT5 | .774 |
.715 | ||||
MT1 | .633 | |||
MT3 | .577 | |||
TT7 | .794 | |||
TT6 | .756 | |||
TT4 | .750 | |||
TT1 | .704 | |||
TT3 | .697 | |||
TT2 | .688 | |||
TT8 | .600 | |||
RR1 | .792 | |||
RR4 | .790 | |||
RR6 | .773 | |||
RR5 | .762 | |||
RR2 | .757 | |||
RR3 | .757 | |||
GS1 | .837 | |||
GS4 | .806 | |||
GS5 | .781 | |||
GS3 | .778 | |||
GS2 | .685 |
a. Rotation converged in 5 iterations. |
PHỤ LỤC 10
KẾT QUẢ PHÂN TÍCH NHÂN TỐ KHÁM PHÁ CHO THANG ĐO TÍNH HỮU HIỆU CỦA HTKSNB TRONG CÁC NHTM
Factor Analysis
Kaiser-Meyer-Olkin Measure of Sampling Adequacy. | .622 | |
Approx. Chi-Square | 127.528 | |
Bartlett's Test of Sphericity | df | 3 |
Sig. | .000 | |
Total Variance Explained
Initial Eigenvalues | Extraction Sums of Squared Loadings | |||||
Total | % of Variance | Cumulative % | Total | % of Variance | Cumulative % | |
1 | 1.899 | 63.305 | 63.305 | 1.899 | 63.305 | 63.305 |
2 | .689 | 22.978 | 86.284 | |||
3 | .411 | 13.716 | 100.000 |
Extraction Method: Principal Component Analysis.
Component Matrixa
Component | |
1 | |
HH1 | .772 |
HH2 | .866 |
HH3 | .744 |
a. 1 components extracted. |
PHỤ LỤC 11
KẾT QUẢ PHÂN TÍCH TƯƠNG QUAN
Correlations
HH | KS | MT | RR | TT | GS | ||
HH | Pearson Correlation | 1 | .414** | .589** | .306** | .225** | .187** |
Sig. (2-tailed) | .000 | .000 | .000 | .001 | .007 | ||
N | 209 | 209 | 209 | 209 | 209 | 209 | |
KS | Pearson Correlation | .414** | 1 | -.022 | .027 | .097 | .236** |
Sig. (2-tailed) | .000 | .752 | .697 | .161 | .001 | ||
N | 209 | 209 | 209 | 209 | 209 | 209 | |
MT | Pearson Correlation | .589** | -.022 | 1 | -.036 | .010 | .003 |
Sig. (2-tailed) | .000 | .752 | .601 | .884 | .962 | ||
N | 209 | 209 | 209 | 209 | 209 | 209 | |
RR | Pearson Correlation | .306** | .027 | -.036 | 1 | .159* | -.030 |
Sig. (2-tailed) | .000 | .697 | .601 | .022 | .665 | ||
N | 209 | 209 | 209 | 209 | 209 | 209 | |
TT | Pearson Correlation | .225** | .097 | .010 | .159* | 1 | .129 |
Sig. (2-tailed) | .001 | .161 | .884 | .022 | .062 | ||
N | 209 | 209 | 209 | 209 | 209 | 209 | |
GS | Pearson Correlation | .187** | .236** | .003 | -.030 | .129 | 1 |
Sig. (2-tailed) | .007 | .001 | .962 | .665 | .062 | ||
N | 209 | 209 | 209 | 209 | 209 | 209 |
**. Correlation is significant at the 0.01 level (2-tailed).
*. Correlation is significant at the 0.05 level (2-tailed).
PHỤ LỤC 12
KẾT QUẢ PHÂN TÍCH HỒI QUY ĐA BIẾN
Variables Entered/Removeda
Variables Entered | Variables Removed | Method | |
1 | GS, MT, RR, TT, KSb | . | Enter |
b. All requested variables entered. |
Model Summaryb
R | R Square | Adjusted R Square | Std. Error of the Estimate | |
1 | .808a | .653 | .645 | .23525 |
b. Dependent Variable: HH |
ANOVAa
Sum of Squares | df | Mean Square | F | Sig. | ||
Regression | 21.161 | 5 | 4.232 | 76.476 | .000b | |
1 | Residual | 11.234 | 203 | .055 | ||
Total | 32.396 | 208 |
b. Predictors: (Constant), GS, MT, RR, TT, KS |
Coefficientsa
Unstandardized Coefficients | Standardized Coefficients | t | Sig. | |||
B | Std. Error | Beta | ||||
(Constant) | -.219 | .250 | -.879 | .381 | ||
KS | .323 | .036 | .386 | 9.056 | .000 | |
1 | TT | .088 | .030 | .123 | 2.895 | .004 |
MT | .386 | .026 | .607 | 14.673 | .000 | |
RR | .212 | .030 | .301 | 7.163 | .000 | |
GS | .052 | .026 | .087 | 2.020 | .045 |
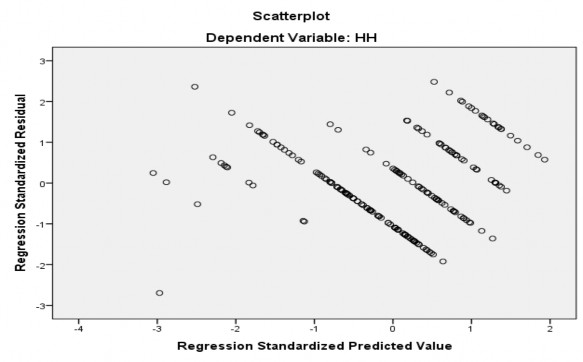
a. Dependent Variable: HH
Residuals Statisticsa
Minimum | Maximum | Mean | Std. Deviation | N | |
Predicted Value | 3.2753 | 4.8648 | 4.2488 | .31896 | 209 |
Residual | -.63435 | .58405 | .00000 | .23240 | 209 |
Std. Predicted Value | -3.052 | 1.931 | .000 | 1.000 | 209 |
Std. Residual | -2.697 | 2.483 | .000 | .988 | 209 |
a. Dependent Variable: HH
Charts