Total Variance Explained
Initial Eigenvalues | Extraction Sums of Squared Loadings | Rotation Sums of Squared Loadings | |||||||
Total | % of Variance | Cumulative % | Total | % of Variance | Cumulati ve % | Total | % of Variance | Cumulative % | |
1 | 9.445 | 36.326 | 36.326 | 9.445 | 36.326 | 36.326 | 4.082 | 15.701 | 15.701 |
2 | 2.989 | 11.496 | 47.822 | 2.989 | 11.496 | 47.822 | 3.870 | 14.886 | 30.587 |
3 | 2.179 | 8.379 | 56.202 | 2.179 | 8.379 | 56.202 | 3.441 | 13.234 | 43.821 |
4 | 1.812 | 6.968 | 63.170 | 1.812 | 6.968 | 63.170 | 3.175 | 12.211 | 56.032 |
5 | 1.193 | 4.590 | 67.760 | 1.193 | 4.590 | 67.760 | 3.049 | 11.727 | 67.760 |
6 | .920 | 3.540 | 71.299 | ||||||
7 | .720 | 2.771 | 74.070 | ||||||
8 | .667 | 2.566 | 76.636 | ||||||
9 | .629 | 2.419 | 79.055 | ||||||
10 | .599 | 2.305 | 81.361 | ||||||
11 | .542 | 2.085 | 83.446 | ||||||
12 | .535 | 2.056 | 85.502 | ||||||
13 | .473 | 1.820 | 86.322 | ||||||
14 | .460 | 1.771 | 87.093 | ||||||
15 | .431 | 1.657 | 88.750 | ||||||
16 | .383 | 1.475 | 89.224 | ||||||
17 | .358 | 1.378 | 90.603 | ||||||
18 | .333 | 1.280 | 91.883 | ||||||
19 | .329 | 1.266 | 92.149 | ||||||
20 | .294 | 1.131 | 93.280 | ||||||
21 | .271 | 1.043 | 94.323 | ||||||
22 | .245 | .941 | 95.264 | ||||||
23 | .191 | .736 | 96.148 | ||||||
24 | .189 | .710 | 98.319 | ||||||
25 | .173 | .670 | 99.103 | ||||||
26 | .165 | .630 | 100.000 |
Có thể bạn quan tâm!
-

 J. Paul Peter Gilbert A. Churchill, Jr. Tom J. Brown ,1993. Caution In The Use Of Difference Scores In Consumer Research. Journal Of Consumer Research, Volume 19, Issue 4, 1 March 1993, Pages 655
 -
 Ảnh hưởng của chất lượng cuộc sống trong công việc đến sự hài lòng và kết quả công việc của các nhân viên ngân hàng tại Bình Dương - 13
 -
 Kết Quả Chạy Định Lượng Sơ Bộ
 -
 Ảnh hưởng của chất lượng cuộc sống trong công việc đến sự hài lòng và kết quả công việc của các nhân viên ngân hàng tại Bình Dương - 16
Xem toàn bộ 137 trang tài liệu này.
Rotated Component Matrixa
Component | ||||||
1 | 2 | 3 | 4 | 5 | 6 | |
XHHT6 | .787 | |||||
XHHT5 | .785 | |||||
XHHT2 | .729 | |||||
XHHT3 | .721 | |||||
XHHT1 | .696 | |||||
XHHT4 | .695 | |||||
HL5 | .781 | |||||
HL3 | .735 | |||||
HL1 | .713 | |||||
HL4 | .664 | |||||
HL2 | .564 | |||||
KQ3 | .781 | |||||
KQ2 | .735 | |||||
KQ4 | .721 | |||||
KQ1 | .713 |
.843 | |||
ATSK4 | .826 | ||
ATSK3 | .817 | ||
ATSK1 | .699 | ||
KTGD2 | .790 | ||
KTGD3 | .723 | ||
KTGD1 | .706 | ||
TTTH4 | .838 | ||
TTTH5 | .828 | ||
TTTH2 | .745 | ||
TTTH3 | .745 |
ATSK2
PHỤ LỤC 6. PHÂN TÍCH TƯƠNG QUAN VA PHÂN TÍCH HỒI QUY
A. ĐẶC ĐIỂM MẪU KHẢO SÁT
Ngan hang
Frequency | Percent | Valid Percent | Cumulative Percent | ||
VCB | 15 | 6,4 | 6,4 | 6,4 | |
SHB | 55 | 23,4 | 23,4 | 29,8 | |
PG | 27 | 11,5 | 11,5 | 41,3 | |
VIETTIN | 43 | 18,3 | 18,3 | 59,6 | |
Valid | LV | 7 | 3,0 | 3,0 | 62,6 |
SHINHAN | 31 | 13,2 | 13,2 | 75,7 | |
VAB | 43 | 18,3 | 18,3 | 94,0 | |
BIDV | 14 | 6,0 | 6,0 | 100,0 | |
Total | 235 | 100,0 | 100,0 |
Phong ban
Frequency | Percent | Valid Percent | Cumulative Percent | ||
Tin dung | 100 | 42,6 | 42,6 | 42,6 | |
Hanh chinh-IT | 22 | 9,4 | 9,4 | 51,9 | |
Dinh gia- Tham dinh | 28 | 11,9 | 11,9 | 63,8 | |
Valid | Ho tro tin dung | 14 | 6,0 | 6,0 | 69,8 |
GDV- Kiem soat | 37 | 15,7 | 15,7 | 85,5 | |
Ke toan- Ngan Quy | 34 | 14,5 | 14,5 | 100,0 | |
Total | 235 | 100,0 | 100,0 |
Chuc Danh
Frequency | Percent | Valid Percent | Cumulative Percent | ||
Quan ly | 41 | 17,4 | 17,4 | 17,4 | |
Valid | Nhan vien | 194 | 82,6 | 82,6 | 100,0 |
Total | 235 | 100,0 | 100,0 |
Gioi Tinh
Frequency | Percent | Valid Percent | Cumulative Percent | ||
Valid | Nam | 108 | 46,0 | 46,0 | 46,0 |
Nu | 127 | 54,0 | 54,0 | 100,0 |
235 | 100,0 | 100,0 | |||
TTHN | |||||
Frequency | Percent | Valid Percent | Cumulative Percent | ||
Doc than | 113 | 48,1 | 48,1 | 48,1 | |
Valid | Da ket hon | 122 | 51,9 | 51,9 | 100,0 |
Total | 235 | 100,0 | 100,0 | ||
Thu nhap | |||||
Frequency | Percent | Valid Percent | Cumulative Percent | ||
7tr< | 32 | 13,6 | 13,6 | 13,6 | |
7tr-12tr | 95 | 40,4 | 40,4 | 54,0 | |
Valid | |||||
12tr> | 108 | 46,0 | 46,0 | 100,0 | |
Total | 235 | 100,0 | 100,0 | ||
Total
B. PHÂN TÍCH TƯƠNG QUAN
Correlations
KQ | HL | ATSK | KTGD | TTTH | XHHT | ||
KQ | Pearson Correlation | 1 | .933** | .508** | .459** | .474** | .581** |
Sig. (2- tailed) | ,000 | ,000 | ,000 | ,000 | ,000 | ||
N | 235 | 235 | 235 | 235 | 235 | 235 | |
HL | Pearson Correlation | .933** | 1 | .562** | .456** | .521** | .519** |
Sig. (2- tailed) | ,000 | ,000 | ,000 | ,000 | ,000 | ||
N | 235 | 235 | 235 | 235 | 235 | 235 | |
ATSK | Pearson Correlation | .508** | .562** | 1 | .280** | .316** | .160* |
Sig. (2- tailed) | ,000 | ,000 | ,000 | ,000 | ,014 | ||
N | 235 | 235 | 235 | 235 | 235 | 235 | |
KTGD | Pearson Correlation | .459** | .456** | .280** | 1 | .249** | .215** |
Sig. (2- tailed) | ,000 | ,000 | ,000 | ,000 | ,001 | ||
N | 235 | 235 | 235 | 235 | 235 | 235 | |
TTTH | Pearson Correlation | .474** | .521** | .316** | .249** | 1 | .224** |
Sig. (2- | ,000 | ,000 | ,000 | ,000 | ,001 |
tailed) | |||||||
N | 235 | 235 | 235 | 235 | 235 | 235 | |
XHHT | Pearson Correlation | .581** | .519** | .160* | .215** | .224** | 1 |
Sig. (2- tailed) | ,000 | ,000 | ,014 | ,001 | ,001 | ||
N | 235 | 235 | 235 | 235 | 235 | 235 |
**. Correlation is significant at the 0.01 level (2-tailed).
*. Correlation is significant at the 0.05 level (2-tailed).
C. THỐNG KÊ CÁC GIÁ TRỊ CỦA THANG ĐO
Statistics
ATSK | KTGD | TTTH | XHHT | HL | KQ | ||
N | Valid | 235 | 235 | 235 | 235 | 235 | 235 |
Missing | 0 | 0 | 0 | 0 | 0 | 0 | |
Mean | 3,4691 | 3,4922 | 3,0798 | 3,6369 | 3,3140 | 3,3660 | |
Std. Deviation | 1,01398 | ,97271 | ,68310 | ,66955 | ,69818 | ,71133 | |
Minimum | 1,00 | 1,00 | 2,00 | 1,50 | 2,00 | 1,75 | |
Maximum | 5,00 | 5,00 | 5,00 | 5,00 | 5,00 | 5,00 | |
D. PHÂN TÍCH MÔ HÌNH HỒI QUY
Phân tích hồi quy mô hình (1)
Variables Entered/Removeda
Variables Entered | Variables Removed | Method | |
1 | XHHT, ATSK, KTGD, TTTHb | Enter |
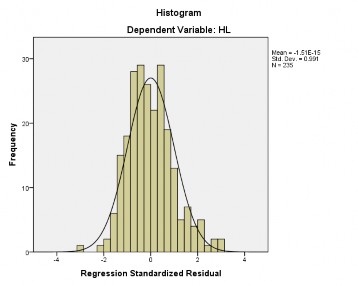
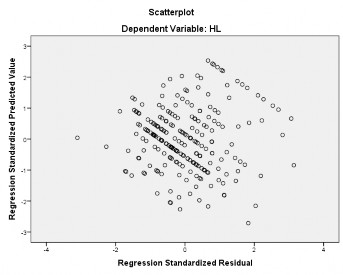
a. Dependent Variable: HL
b. All requested variables entered.
R | R Square | Adjusted R Square | Std. Error of the Estimate | |
1 | .791a | ,626 | ,620 | ,43056 |
Sum of Squares | df | Mean Square | |||||||||
Regression | 71,426 | 4 | 17,857 | ||||||||
1 | Residual | 42,637 | 230 | ,185 | |||||||
Total | 114,064 | 234 | |||||||||
Model 1 | Unstandardized Coefficients | Standardized Coefficients | t | Sig. | Collinearity Statistics | ||||||
B | Std. Error | Beta | Zero- order | Tolerance | VIF | ||||||
Constant | -,286 | ,193 | -1,481 | ,140 | |||||||
ATSK | ,248 | ,030 | ,359 | 8,237 | ,000 | ,562 | ,853 | 1,172 | |||
KTGD | ,151 | ,031 | ,211 | 4,879 | ,000 | ,456 | ,872 | 1,147 | |||
TTTH | ,282 | ,045 | ,276 | 6,303 | ,000 | ,521 | ,850 | 1,176 | |||
XHHT | ,370 | ,044 | ,355 | 8,439 | ,000 | ,519 | ,919 | 1,088 | |||
Phân tích hồi quy mô hình (2)
Variables Entered/Removeda
Variables Entered | Variables Removed | Method | |
2 | XHHT, ATSK, KTGD, TTTHb | Enter |
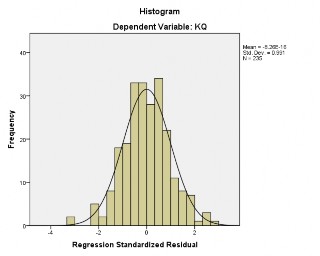
a. Dependent Variable: KQ
b. All requested variables entered.
Model Summaryb
R | R Square | Adjusted R Square | Std. Error of the Estimate | Durbin- Watson | |
2 | .785a | ,617 | ,610 | ,44430 | 1,938 |
a. Predictors: (Constant), XHHT, ATSK, KTGD, TTTH
b. Dependent Variable: KQ
ANOVAa
Sum of Squares | df | Mean Square | F | Sig. | ||
Regression | 73,000 | 4 | 18,250 | 92,451 | .000b | |
2 | Residual | 45,402 | 230 | ,197 | ||
Total | 118,403 | 234 |
a. Dependent Variable: KQ
b. Predictors: (Constant), XHHT, ATSK, KTGD, TTTH
Unstandardized Coefficients | Standardized Coefficients | t | Sig. | Collinearity Statistics | ||||
B | Std. Error | Beta | Tolerance | VIF | ||||
(Constant) | -,346 | ,199 | -1,737 | ,084 | ||||
ATSK | ,214 | ,031 | ,305 | 6,898 | ,000 | ,853 | 1,172 | |
2 | KTGD | ,164 | ,032 | ,224 | 5,130 | ,000 | ,872 | 1,147 |
TTTH | ,234 | ,046 | ,225 | 5,070 | ,000 | ,850 | 1,176 | |
XHHT | ,461 | ,045 | ,434 | 10,191 | ,000 | ,919 | 1,088 |