Eigenvalues of the Correlation Matrix
Eigenvalue | Difference | Proportion | Cumulative | |
1 | 1.94323142 | 0.76006766 | 0.4116 | 0.4116 |
2 | 1.18316376 | 0.11083883 | 0.2936 | 0.6253 |
3 | 1.07232493 | 0.60855136 | 0.2145 | 0.8397 |
4 | 0.46377357 | 0.12626725 | 0.0928 | 0.9325 |
5 | 0.33750632 | 0.0675 | 1.0000 | |
Eigenvectors | ||||
Có thể bạn quan tâm!
-

 Xây dựng ngưỡng thông số sinh lý mủ trên một số dòng vô tính cao su Hevea brasiliensis Muell. Arg - 18
 -
 Xây dựng ngưỡng thông số sinh lý mủ trên một số dòng vô tính cao su Hevea brasiliensis Muell. Arg - 19
 -
 Xây dựng ngưỡng thông số sinh lý mủ trên một số dòng vô tính cao su Hevea brasiliensis Muell. Arg - 20
 -
 Xây dựng ngưỡng thông số sinh lý mủ trên một số dòng vô tính cao su Hevea brasiliensis Muell. Arg - 22
 -
 Xây dựng ngưỡng thông số sinh lý mủ trên một số dòng vô tính cao su Hevea brasiliensis Muell. Arg - 23
 -
 Xây dựng ngưỡng thông số sinh lý mủ trên một số dòng vô tính cao su Hevea brasiliensis Muell. Arg - 24
Xem toàn bộ 200 trang tài liệu này.
Prin1 | Prin2 | Prin3 | Prin4 | Prin5 | |
DUONG | 0.044752 | 0.876213 | -.010043 | -.280734 | -.389020 |
Pi | 0.585377 | 0.087912 | 0.231164 | 0.725517 | -.264184 |
RSH | 0.601413 | 0.224004 | -.218296 | -.183620 | 0.711867 |
TSC | -.432231 | 0.353808 | 0.577051 | 0.307781 | 0.510176 |
NS | 0.326818 | -.221731 | 0.752211 | -.516108 | -.108795 |
The SAS System
Obs CLONE Prin1 Prin2 Prin3 Prin4 Prin5
GT000001 | 0.17102 | 2.01453 | -2.05588 | -0.47998 | -1.08703 | |
2 | LH970685 | -2.93017 | 0.16110 | -0.55279 | 0.26570 | 0.22944 |
3 | LH960083 | -0.04961 | 0.98093 | -1.07334 | 0.33461 | -0.73240 |
4 | LH930348 | 0.17169 | -0.88855 | -1.15598 | 0.68282 | -0.26661 |
5 | LH950089 | -1.18804 | 2.16575 | 0.12929 | 0.19274 | 0.18876 |
6 | LH930349 | -2.44737 | 0.58577 | 0.34009 | 0.22456 | 0.48586 |
7 | PB000260 | -0.27760 | -1.08823 | -0.43659 | 1.06171 | 0.62781 |
8 | LH960109 | -0.52554 | -0.17039 | -0.30870 | 0.93743 | -0.51385 |
9 | LH950466 | -0.84582 | 0.88010 | 0.36811 | 0.85748 | 0.54889 |
10 | LH930170 | -2.39825 | -1.60152 | -0.72639 | -0.47350 | -0.31026 |
11 | LH950214 | 1.47971 | 1.79133 | -0.77001 | 0.21480 | 0.85744 |
12 | LH980976 | 1.57001 | -1.08216 | -1.62604 | 0.29482 | 0.24032 |
13 | PB000235 | 1.67462 | -0.48968 | -1.21913 | 0.54834 | 0.95779 |
14 | LH940545 | -2.85189 | -0.16978 | 0.66835 | 0.10699 | 0.06622 |
15 | LH950091 | 0.85783 | 1.27004 | -1.06570 | -0.68957 | -0.38132 |
16 | LH930107 | 0.23210 | -0.39452 | -0.42867 | 0.58237 | -0.94441 |
17 | LH930255 | -0.07737 | -1.61539 | -1.88463 | -1.91638 | 0.61549 |
18 | LH940630 | -0.35101 | 1.58285 | 0.29061 | -0.23087 | -0.12740 |
19 | LTD98517 | 1.35190 | -1.47496 | -0.70724 | 0.49369 | -0.45561 |
20 | LH940261 | -2.00635 | -0.41804 | 0.57274 | -0.30939 | -0.03830 |
21 | LH970648 | -1.01860 | -0.13988 | 0.81663 | 0.48084 | -0.14696 |
22 | LH950376 | 0.86964 | 0.84103 | 0.34241 | -0.04695 | 0.87600 |
23 | LH890177 | -0.28980 | 0.17484 | -0.29351 | -1.31801 | 0.33914 |
24 | LH950197 | 1.99397 | 0.18593 | 0.51474 | 1.16436 | 0.23020 |
25 | RRIV0004 | -0.17154 | -1.27287 | 0.64851 | 0.24797 | 0.18442 |
26 | LH930124 | 1.22554 | 1.11250 | 0.82078 | -0.23503 | -1.01614 |
27 | LH970039 | -0.39144 | -0.18480 | 1.48386 | -0.25469 | 0.55538 |
28 | LH970490 | -0.40607 | -0.90025 | 1.24688 | -0.39554 | -0.78667 |
29 | LH980377 | 1.42955 | -1.09244 | 0.70414 | -0.23087 | 0.13907 |
30 | LH960138 | 0.94920 | -1.35652 | 0.50046 | -0.59148 | -0.46328 |
31 | LH950147 | 1.73916 | 0.09884 | 1.32382 | -0.28043 | 0.48199 |
32 | LH950090 | 1.00328 | 0.91670 | 1.25081 | -1.19820 | 0.45353 |
33 | LH980174 | 1.50726 | -0.42227 | 2.28236 | -0.04034 | -0.80752 |
Tương quan giữa năng suất với các thông số sinh lý mủ (giai đoạn cây trưởng thành)
The SAS System The CORR Procedure
5 Variables: Duong Pi RSH TSC Nangsuat
Simple Statistics
N | Mean | Std Dev | Sum | |
Duong | 99 | 6.88485 | 3.62760 | 681.60015 |
Pi | 99 | 19.34242 | 6.35438 | 1914.8995 |
RSH | 99 | 0.73576 | 0.14994 | 72.84024 |
TSC | 99 | 37.94848 | 3.04981 | 3756.89952 |
Nangsuat | 99 | 36.56970 | 12.35770 | 3620.4003 |
Simple Statistics
Minimum | Maximum | |
Duong | 2.60000 | 15.00000 |
Pi | 6.00000 | 30.70000 |
RSH | 0.52000 | 1.17000 |
TSC | 30.50000 | 45.60000 |
Nangsuat | 16.80000 | 61.70000 |
Pearson Correlation Coefficients, N = 99 Prob > |r| under H0: Rho=0
Duong 1.00000 | Pi -0.05320 | RSH 0.15687 | TSC -0.31093 | Nangsuat -0.21109 | |
0.4837 | 0.1525 | 0.0447 | 0.0361 | ||
Pi | -0.05320 | 1.00000 | 0.51202 | -0.15763 | 0.59553 |
0.4837 | <.0001 | 0.5501 | 0.0028 | ||
RSH | 0.15687 | 0.51202 | 1.00000 | -0.36715 | 0.26941 |
0.1525 | <.0001 | <.0001 | 0.0080 | ||
TSC | -0.31093 | -0.15763 | -0.36715 | 1.00000 | 0.21050 |
0.0447 | 0.5501 | <.0001 | 0.3174 | ||
Nangsuat | -0.21109 | 0.59553 | 0.26941 | 0.21050 | 1.00000 |
0.0361 | 0.0028 | 0.0080 | 0.3174 |
Kết quả phân tích thành phần chính (PCA) giai đoạn cây trưởng thành
The SAS System
The PRINCOMP Procedure
Observations 33
Variables 5
Simple Statistics
DUONG | Pi | RSH | |
Mean | 6.884848485 | 19.34242424 | 0.7357575758 |
StD | 3.627595727 | 6.35437990 | 0.1499381185 |
Simple Statistics
TSC | NS | |
Mean | 37.94848485 | 36.56969697 |
StD | 3.04980750 | 12.35770217 |
Correlation Matrix
DUONG | Pi | RSH | TSC | NS | |
DUONG | 1.0000 | -.0530 | 0.1569 | -.3109 | -.2110 |
Pi | -.0530 | 1.0000 | 0.5120 | 0.1570 | 0.5959 |
RSH | 0.269- | 0.5120 | 1.0000 | -.3670 | 0.2690 |
TSC | -.3109 | 0.1570 | -.3670 | 1.0000 | 0.2103 |
NS | -.2110 | 0.5959 | 0.2690 | 0.2103 | 1.0000 |
Eigenvalues of the Correlation Matrix
Eigenvalue | Difference | Proportion | Cumulative | |
1 | 2.01336798 | 0.38822488 | 0.4027 | 0.4027 |
2 | 1.62514310 | 0.89875079 | 0.3250 | 0.7277 |
3 | 0.72639232 | 0.31863052 | 0.1453 | 0.8730 |
4 | 0.40776180 | 0.18042700 | 0.0816 | 0.9545 |
5 | 0.22733480 | 0.0455 | 1.0000 |
Eigenvectors
Prin1 | Prin2 | Prin3 | Prin4 | Prin5 | |
DUONG | -.107032 | 0.550663 | 0.805299 | -.161492 | 0.103576 |
Pi | 0.648458 | 0.031220 | 0.184926 | 0.133442 | -.725619 |
RSH | 0.430200 | 0.507241 | -.236995 | 0.549318 | 0.446898 |
TSC | 0.123880 | -.641294 | 0.510943 | 0.471497 | 0.300038 |
NS | 0.606324 | -.165057 | 0.008140 | -.657308 | 0.415942 |
The SAS System
CLONE | Prin1 | Prin2 | Prin3 | Prin4 | Prin5 | |
1 | LH89177 | -1.63908 | 0.68572 | 0.85291 | -0.17557 | 0.03858 |
2 | LH93107 | -0.52683 | -0.11240 | 0.09309 | -0.39261 | -0.71011 |
3 | LH93124 | -2.20502 | 0.61173 | 2.11882 | 0.22730 | -0.05196 |
4 | LH93170 | -2.75921 | -0.55470 | -0.86912 | 0.13463 | 0.18560 |
5 | LH93255 | -1.50006 | -0.09428 | -1.56832 | -1.10445 | 0.94630 |
6 | LH93348 | -0.83016 | -0.69487 | -0.47064 | 0.39144 | -0.57197 |
7 | LH93349 | 1.16007 | 1.10886 | 1.44961 | -0.35442 | -0.51066 |
8 | LH94261 | -1.60238 | 0.51228 | -0.25163 | -0.34603 | 0.27159 |
9 | LH94545 | -1.35894 | 0.65628 | -0.27599 | -0.13248 | -0.25236 |
10 | LH94630 | 0.39138 | -0.87102 | 0.57919 | 0.32189 | -1.05493 |
11 | LH95147 | 1.76730 | 1.45702 | -1.20624 | -0.12775 | 0.10583 |
12 | LH95197 | 0.19914 | -1.19002 | 0.15695 | 0.78586 | 0.19036 |
13 | LH95214 | 0.82628 | 0.13025 | 0.03610 | -0.06629 | -0.18235 |
14 | LH95376 | 1.89880 | 1.99140 | 0.83697 | 1.37096 | 1.15111 |
15 | LH95466 | 0.84652 | 0.69956 | -0.81237 | 1.46960 | -0.05186 |
16 | LH9589 | 1.82764 | 1.27056 | 1.44052 | -1.21994 | 0.16996 |
17 | LH9590 | 2.62613 | 1.06848 | -0.73590 | -0.47823 | -0.34587 |
18 | LH9591 | 0.14958 | 1.68292 | -0.10435 | 0.60742 | 0.19196 |
19 | LH97648 | 0.52749 | -1.93280 | 0.95155 | -0.48439 | 0.31229 |
20 | LH98174 | 1.14794 | -1.69421 | 0.21773 | -0.20523 | 0.50279 |
21 | LH98377 | -0.35473 | -1.30206 | -0.59129 | 0.17101 | 0.01575 |
22 | LTD98517 | 1.89129 | -0.36762 | -0.25873 | -1.07524 | 0.29211 |
23 | LH96109 | -0.44832 | -1.39276 | 0.08113 | 0.28684 | -0.92014 |
24 | LH9683 | -1.46723 | 2.16065 | 1.12234 | 0.07079 | -0.02079 |
25 | LH97490 | 0.18610 | -0.95464 | -0.45489 | -0.44584 | -0.36712 |
26 | LH97685 | -1.27362 | 0.19146 | -0.64655 | -0.22272 | 0.25674 |
27 | LH96138 | 2.15260 | -0.48542 | -0.37392 | -0.62505 | -0.14170 |
28 | LH9739 | 0.90781 | -2.21247 | 0.33124 | 0.16094 | 0.03685 |
29 | GT1 | -2.01105 | 2.16202 | -0.91913 | -0.52931 | -0.29153 |
30 | PB235 | 0.76653 | 0.33552 | -1.05195 | 0.59118 | -0.10135 |
31 | PB260 | 0.63459 | -0.17591 | -0.66233 | 1.16304 | -0.18863 |
32 | RRIV4 | -0.81805 | -2.84633 | 0.76806 | 0.29913 | 0.83784 |
33 | LH98976 | -1.11253 | 0.15681 | 0.21710 | -0.06645 | 0.25767 |
Tương quan giữa năng suất và các thông số sinh lý mủ ở giai đoạn cây non và cây trưởng thành
The SAS System The CORR Procedure
RSH(N) RSH(TT) | DUONG(N) | DUONG(TT) | Pi(N) | |
Pi(TT) TSC(N) | TSC(TT) | NS (N) | NS (TT) |
Simple Statistics
N | Mean | Std Dev | Sum | |
RSH(N) | 99 | 0.84242 | 0.12508 | 83.39958 |
RSH(TT) | 99 | 0.73576 | 0.14994 | 72.84024 |
DUONG(N) | 99 | 13.51515 | 5.16818 | 1337.99985 |
DUONG(TT) | 99 | 6.87727 | 3.62636 | 680.84973 |
Pi(N) | 99 | 14.11515 | 4.47312 | 1397.39985 |
Pi(TT) | 99 | 19.34303 | 6.34159 | 1914.95997 |
TSC(N) | 99 | 27.83939 | 2.89341 | 2756.0996 |
TSC(TT) | 99 | 37.95030 | 3.05638 | 3757.0797 |
NS (N) | 99 | 6.15707 | 2.41012 | 609.55000 |
NS(TT) | 99 | 36.56970 | 12.35770 | 3620.4003 |
Simple Statistics
Minimum | Maximum | |
RSH(N) | 0.60000 | 1.10000 |
RSH(TT) | 0.52000 | 1.17000 |
DUONG(N) | 6.00000 | 24.50000 |
DUONG(TT) | 2.56000 | 15.02000 |
Pi(N) | 5.50000 | 23.10000 |
Pi(TT) | 6.05000 | 30.70000 |
TSC(N) | 21.70000 | 32.60000 |
TSC(TT) | 30.52000 | 45.64000 |
NS (N) | 2.23000 | 11.83000 |
NS(TT) | 16.80000 | 61.70000 |
Pearson Correlation Coefficients, N = 99 Prob > |r| under H0: Rho=0
RSH(N) 1.00000 | RSH(TT) 0.52980 | DUONG(N) 0.15948 | DUONG(TT) 0.01418 | |
0.0015 | 0.3754 | 0.9376 | ||
RSH(TT) | 0.52980 | 1.00000 | 0.23894 | 0.19649 |
0.0015 | 0.1805 | 0.2731 | ||
DUONG(N) | 0.15948 | 0.23894 | 1.00000 | 0.70867 |
0.3754 | 0.1805 | <.0001 |
Pearson Correlation Coefficients, N = 99 Prob > |r| under H0: Rho=0
Pi(N) Pi(TT) TSC(N) TSC(TT) NS (N) NS (TT)
0.17850 | -0.44515 | -0.08963 | 0.18887 | 0.3046 | |
0.0012 | 0.3203 | 0.0094 | 0.6199 | 0.0330 | 0.0847 |
RSH(TT) 0.24737 | 0.51195 | 0.02763 | -0.37296 | -0.1659 | 0.26941 |
0.1652 | 0.0023 | 0.8787 | 0.0325 | 0.3560 | 0.0080 |
DUONG(N)-0.05071 | 0.16720 | 0.24158 | -0.36419 | 0.10609 | 0.1583 |
0.7793 | 0.3524 | 0.1756 | 0.0372 | 0.0361 | 0.3787 |
NS (N) 0.29753 | -0.05933 | 0.10350 | 0.25451 | 1.0000 | 0.5570 |
0.0028 | 0.7429 | 0.0074 | 0.1729 | 0.0026 | |
NS (TT) 0.22950 | 0.59550 | 0.04348 | 0.21050 | 0.5570 | 1.0000 |
0.1989 | 0.0028 | 0.8101 | 0.3174 | 0.0026 |
The SAS System The CORR Procedure
Pearson Correlation Coefficients, N = 99 Prob > |r| under H 0: Rho=0
RSH(N) RSH(TT) DUONG(N) DUONG(TT)
0.01418 | 0.19649 | 0.70867 | 1.00000 | |
0.9376 | 0.2731 | <.0001 | ||
Pi(N) | 0.54006 | 0.24737 | -0.05071 | -0.21804 |
0.0012 | 0.1652 | 0.7793 | 0.2228 | |
Pi(TT) | 0.17850 | 0.51195 | 0.16720 | -0.02993 |
0.3203 | 0.0023 | 0.3524 | 0.8687 | |
TSC(N) | -0.44515 | 0.02763 | 0.24158 | 0.21412 |
0.0094 | 0.8787 | 0.1756 | 0.2315 | |
TSC(TT) | -0.08963 | -0.37296 | -0.36419 | -0.32734 |
0.6199 | 0.0325 | 0.0372 | 0.0630 |
0.18887 | -0.1659 | 0.1069 | -0.2843 | |
0.0330 | -0.3561 | 0.0361 | 0.6522 | |
NS (TT) | 0.3046 | 0.2694 | 0.1583 | -0.2110 |
0.0847 | 0.0086 | 0.3787 | 0.0369 |
Pearson Correlation Coefficients, N = 33 Prob > |r| under H0: Rho=0
Pi(N) -0.21804 | Pi(TT) -0.02993 | TSC(N) 0.21412 | TSC(TT) -0.32734 | |
0.2228 | 0.8687 | 0.2315 | 0.0630 | |
Pi(N) | 1.00000 | 0.45909 | -0.30910 | 0.37334 |
0.0072 | 0.0801 | 0.0324 | ||
Pi(TT) | 0.45909 | 1.00000 | 0.25232 | 0.17218 |
0.0072 | 0.1566 | 0.3380 | ||
TSC(N) | -0.30910 | 0.25232 | 1.00000 | 0.21801 |
0.0801 | 0.1566 | 0.2229 | ||
TSC(TT) | 0.37334 | 0.17218 | 0.21801 | 1.00000 |
0.0324 | 0.3380 | 0.2229 | ||
NS (N) | 0.29753 | -0.05933 | 0.10350 | 0.25451 |
0.0361 | 0.7429 | 0.0074 | 0.1729 | |
NS(TT) | 0.22950 | 0.59550 | 0.04348 | 0.21050 |
0.1989 | 0.0028 | 0.8101 | 0.3174 |
Phụ lục 7 Kết quả xử lý thống kê nội dung 3
Kết quả phân tích thống kê phân phối chuẩn các thông số sinh lý mủ của dvt RRIV 1 (không biến đổi số liệu)
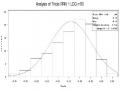
The UNIVARIATE Procedure Fitted Distribution for Thiols
Parameters for Normal Distribution
Parameter Symbol Estimate Mean Mu 0.750786
Std Dev Sigma 0.184374
Goodness-of-Fit Tests for Normal Distribution Test ---Statistic---- -----p Value-----
Kolmogorov-Smirnov D 0.06060086 Pr > D 0.134 Cramer-von Mises W-Sq 0.07912575 Pr > W-Sq 0.218 Anderson-Darling A-Sq 0.55536411 Pr > A-Sq 0.153
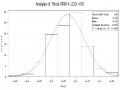
The UNIVARIATE Procedure Fitted Distribution for Duong
Parameters for Normal Distribution
Parameter Symbol Estimate Mean Mu 9.622357
Std Dev Sigma 3.434034
Goodness-of-Fit Tests for Normal Distribution Test ---Statistic---- -----p Value-----
Kolmogorov-Smirnov D 0.09452889 Pr > D <0.010 Cramer-von Mises W-Sq 0.35463371 Pr > W-Sq <0.005 Anderson-Darling A-Sq 2.22402038 Pr > A-Sq <0.005
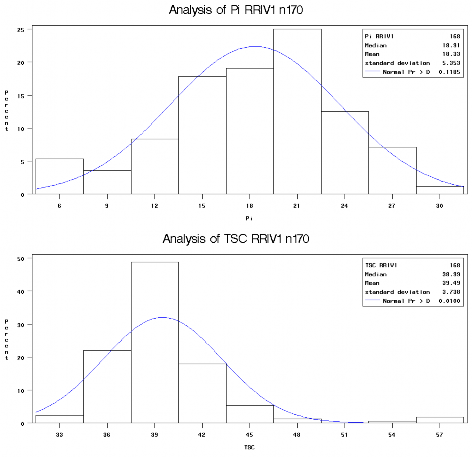
The UNIVARIATE Procedure Fitted Distribution for Pi
Parameters for Normal Distribution Parameter Symbol Estimate
Mean Mu 18.32561
Std Dev Sigma 5.352531
Goodness-of-Fit Tests for Normal Distribution Test ---Statistic---- -----p Value-----
Kolmogorov-Smirnov D 0.06166818 Pr > D 0.118 Cramer-von Mises W-Sq 0.14614182 Pr > W-Sq 0.027 Anderson-Darling A-Sq 1.05268326 Pr > A-Sq 0.009
The UNIVARIATE Procedure Fitted Distribution for TSC
Parameters for Normal Distribution Parameter Symbol Estimate
Mean Mu 39.48802
Std Dev Sigma 3.738221
Goodness-of-Fit Tests for Normal Distribution Test ---Statistic---- -----p Value-----
Kolmogorov-Smirnov D 0.14251793 Pr > D <0.010 Cramer-von Mises W-Sq 0.93268209 Pr > W-Sq <0.005 Anderson-Darling A-Sq 5.88932015 Pr > A-Sq <0.005
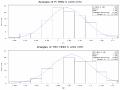
Tổng hợp kết quả test phân phối chuẩn bằng đồ thị histogram Số liệu không biến đổi
Số mẫu: n = 170
Kết quả phân tích thống kê phân phối chuẩn các thông số sinh lý mủ của dvt RRIV 1 (số liệu logarit thập phân)
The UNIVARIATE Procedure Fitted Distribution for Thiols
Parameters for Normal Distribution Parameter Symbol Estimate
Mean Mu -0.13847
Std Dev Sigma 0.112879 Goodness-of-Fit Tests for Normal Distribution
Test ---Statistic---- -----p Value-----
Kolmogorov-Smirnov D 0.09571625 Pr > D <0.010 Cramer-von Mises W-Sq 0.27909612 Pr > W-Sq <0.005 Anderson-Darling A-Sq 1.67345127 Pr > A-Sq <0.005
The UNIVARIATE Procedure Fitted Distribution for Duong
Parameters for Normal Distribution Parameter Symbol Estimate
Mean Mu 0.956804
Std Dev Sigma 0.153107