Model | Sum of Squares | df | Mean Square | F | Sig. | |
1 | Regression | 99.877 | 2 | 49.938 | 303.200 | 0.000 |
Residual | 57.153 | 347 | 0.165 | |||
Total | 157.029 | 349 | ||||
a. Predictors: (Constant), Tin đồn thương hiệu, thái độ thương hiệu | ||||||
b. Dependent Variable: Sự phán xét thương hiệu | ||||||
Có thể bạn quan tâm!
-

 Theo Anh/chị, Hiểu Biết Về “Bằng Chứng Thương Hiệu” Cửa Một Thương Hiệu Dịch Vụ Cà Phê Thể Hiện Qua Những Yếu Tố Nào?
 -
 Phân Tích Tương Quan Giữa Các Yếu Tố Ảnh Hưởng
 -
 Phân Tích Kiểm Định Mô Hình Hồi Quy Thái Độ Thương Hiệu Và Sự Phán Xét Thương Hiệu Thương Hiệu
 -
 Tác động của bằng chứng, tin đồn và thái độ thương hiệu lên sự phán xét thương hiệu của khách hàng trong việc sử dụng dịch vụ tại các chuỗi cửa hàng cà phê - 18
Xem toàn bộ 151 trang tài liệu này.

Model | Unstandardized Coefficients | Standardized Coefficients | t | Sig. | ||
B | Std. Error | Beta | ||||
1 | (Constant) | 0.289 | 0.131 | 2.199 | 0.029 | |
TD | 0.834 | 0.052 | 0.720 | 5.926 | 0.000 | |
TDTH | 0.090 | 0.038 | 0.106 | 2.351 | 0.019 | |
a. Dependent Variable: Sự phán xét thương hiệu | ||||||
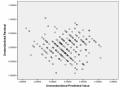
11. Kiểm tra các giả định của phương trình hồi quy kiểm định mối quan hệ giữa từng yếu tố tác động và sự phán xét thương hiệu và thái độ thương hiệu
11.1. Kiểm tra liên hệ tuyến tính
![]()
O
@ O
O
”
O
O
O
O
O
O
O
O
O OO
O
’ O’
O
O
O O
O
O
O
O O
4b O
O
O
O
O O
Unstandardized Predicted Value
11.2. Kiểm tra phương sai của phần dư không đổi
Spearman's rho
Correlations
ABSTDTDTH PX
ABSTDTDTH Correlation 1.000 0.056
Coefficient
Sig. (2-tailed) . 0.294
N 350 350
PX Correlation 0.056 1.000
Coefficient
Sig. (2-tailed) 0.294 .
N 350 350
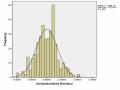
11.3. Kiểm tra phần dư có phân phối chuẩn
![]()
![]()
12. Kiểm định sự khác biệt trung bình tổng thể
12.1. Theo giới tính
Gender | N | Mean | Std. Deviation | Std. Error Mean | ||
PX | 1 | 258.000 | 3.417 | 0.664 | 0.041 | |
2 | 92.000 | 3.614 | 0.671 | 0.070 | ||
Levene's Test for Equality of Variances | t-test for Equality of Means | |||||||||
F | Sig. | t | df | Sig. (2- tailed) | Mean Difference | Std. Error Difference | 95% Confidence Interval of the Difference | |||
Lower | Upper | |||||||||
PX | Equal variances assumed | 0.233 | 0.629 | (2.441) | 348.000 | 0.015 | (0.197) | 0.081 | (0.357) | (0.038) |
Equal variances not assumed | (2.431) | 158.959 | 0.016 | (0.197) | 0.081 | (0.358) | (0.037) | |||
12.2 Theo độ tuổi
PX | ||||||||||
N | Mean | Std. Deviatio n | Std. Error | 95% Confidence Interval for Mean | Minimu m | Maximum | Between- Component Variance | |||
Lower Bound | Upper Bound | |||||||||
1 | 58 | 3.6293 | .70593 | .09269 | 3.4437 | 3.8149 | 2.25 | 5.00 | ||
2 | 160 | 3.4281 | .63777 | .05042 | 3.3285 | 3.5277 | 1.00 | 5.00 | ||
3 | 104 | 3.4856 | .70953 | .06957 | 3.3476 | 3.6236 | 1.75 | 5.00 | ||
4 | 28 | 3.3036 | .59456 | .11236 | 3.0730 | 3.5341 | 2.00 | 4.50 | ||
Total | 350 | 3.4686 | .67078 | .03585 | 3.3981 | 3.5391 | 1.00 | 5.00 | ||
Model | Fixed Effects | .66818 | .03572 | 3.3983 | 3.5388 | |||||
Random Effects | .05470 | 3.2945 | 3.6426 | .00518 | ||||||
PX | |||
Levene Statistic | df1 | df2 | Sig. |
1.063 | 3 | 346 | .365 |
PX | |||||
Sum of Squares | df | Mean Square | F | Sig. | |
Between Groups | 2.553 | 3 | .851 | 1.906 | .128 |
Within Groups | 154.477 | 346 | .446 | ||
Total | 157.029 | 349 | |||
Dependent Variable:PX | |||||||
Tukey HSD | (I) Age | (J) Age | Mean Difference (I-J) | Std. Error | Sig. | 95% Confidence Interval | |
Lower Bound | Upper Bound | ||||||
1 | 2 3 4 | .20119 | .10241 | .204 | -.0632 | .4656 | |
.14373 | .10950 | .555 | -.1390 | .4264 | |||
.32574 | .15376 | .149 | -.0712 | .7227 | |||
12.3. Theo tình trạng hôn nhân
HONNHAN | N | Mean | Std. Deviation | Std. Error Mean | ||
PX | 1.00 | 100 | 3.4350 | .67572 | .06757 | |
2.00 | 250 | 3.4820 | .66968 | .04235 | ||
Group Statistics
Levene's Test for Equality of Variances | t-test for Equality of Means | |||||||||
F | Sig. | t | df | Sig. (2- tailed) | Mean Difference | Std. Error Difference | 95% Confidence Interval of the Difference | |||
Lower | Upper | |||||||||
PX | Equal variances assumed | .075 | .785 | -.592 | 348 | .554 | -.04700 | .07944 | -.20325 | .10925 |
Equal variances not assumed | -.589 | 180.967 | .556 | -.04700 | .07975 | -.20436 | .11036 | |||
12.4. Theo mức thu nhập trung bình / tháng
PX | ||||||||||
N | Mean | Std. Deviatio n | Std. Error | 95% Confidence Interval for Mean | Minimu m | Maximum | Between- Component Variance | |||
Lower Bound | Upper Bound | |||||||||
1 | 86 | 3.5087 | .63529 | .06851 | 3.3725 | 3.6449 | 2.25 | 5.00 | ||
2 | 204 | 3.4485 | .66616 | .04664 | 3.3566 | 3.5405 | 1.00 | 5.00 | ||
3 | 60 | 3.4792 | .74118 | .09569 | 3.2877 | 3.6706 | 2.00 | 5.00 | ||
Total | 350 | 3.4686 | .67078 | .03585 | 3.3981 | 3.5391 | 1.00 | 5.00 | ||
Model | Fixed Effects | .67222 | .03593 | 3.3979 | 3.5392 | |||||
Random Effects | .03593 | 3.3140 | 3.6232 | -.00339 | .00518 | |||||
PX | |||
Levene Statistic | df1 | df2 | Sig. |
.572 | 2 | 347 | .565 |
PX | |||||
Sum of Squares | df | Mean Square | F | Sig. | |
Between Groups | .227 | 2 | .114 | .252 | .778 |
Within Groups | 156.802 | 347 | .452 | ||
Total | 157.029 | 349 | |||
ANOVA
Dependent Variable:PX | |||||||
Tukey HSD | (I) Income | (J) Income | Mean Difference (I-J) | Std. Error | Sig. | 95% Confidence Interval | |
Lower Bound | Upper Bound | ||||||
1 | 2 3 | .06019 | .08643 | .766 | -.1432 | .2636 | |
.02955 | .11307 | .963 | -.2366 | .2957 | |||
12.5. Theo trình độ học vấn
PX | ||||||||||
N | Mean | Std. Deviation | Std. Error | 95% Confidence Interval for Mean | Minimum | Maximum | Between- Compone nt Variance | |||
Lower Bound | Upper Bound | |||||||||
1 | 17 | 3.4265 | .65410 | .15864 | 3.0902 | 3.7628 | 2.75 | 5.00 | ||
2 | 311 | 3.4743 | .65818 | .03732 | 3.4008 | 3.5477 | 1.50 | 5.00 | ||
3 | 22 | 3.4205 | .86735 | .18492 | 3.0359 | 3.8050 | 1.00 | 5.00 | ||
Total | 350 | 3.4686 | .67078 | .03585 | 3.3981 | 3.5391 | 1.00 | 5.00 | ||
Mode l | Fixed Effects | .67251 | .03595 | 3.3979 | 3.5393 | |||||
Random Effects | .03595 | 3.3139 | 3.6232 | -.01138 | .00518 | |||||
PX | |||
Levene Statistic | df1 | df2 | Sig. |
.336 | 2 | 347 | .715 |
PX | |||||
Sum of Squares | df | Mean Square | F | Sig. | |
Between Groups | .091 | 2 | .046 | .101 | .904 |
Within Groups | 156.938 | 347 | .452 | ||
Total | 157.029 | 349 | |||
Dependent Variable:PX | |||||||
Tukey HSD | (I) TDHV | (J) TDHV | Mean Difference (I-J) | Std. Error | Sig. | 95% Confidence Interval | |
Lower Bound | Upper Bound | ||||||
1 | 2 3 | -.04781 | .16751 | .956 | -.4421 | .3465 | |
.00602 | .21717 | 1.000 | -.5052 | .5172 | |||
Multiple Comparisons
12.6. Theo lĩnh vực công tác
PX | ||||||||||
N | Mean | Std. Deviation | Std. Error | 95% Confidence Interval for Mean | Minimum | Maximum | Between- Compone nt Variance | |||
Lower Bound | Upper Bound | |||||||||
1 | 45 | 3.3252 | .63229 | .04953 | 3.2274 | 3.4230 | 1.00 | 5.00 | ||
2 | 25 | 3.5459 | .67769 | .05391 | 3.4394 | 3.6524 | 2.00 | 5.00 | ||
3 | 5 | 3.8913 | .62535 | .13039 | 3.6209 | 4.1617 | 2.75 | 5.00 | ||
4 | 87 | 3.7083 | .74861 | .30562 | 2.9227 | 4.4940 | 3.00 | 5.00 | ||
5 | 93 | 3.3252 | .63229 | .04953 | 3.2274 | 3.4230 | 1.00 | 5.00 | ||
6 | 10 | 3.5459 | .67769 | .05391 | 3.4394 | 3.6524 | 2.00 | 5.00 | ||
7 | 78 | 3.8913 | .62535 | .13039 | 3.6209 | 4.1617 | 2.75 | 5.00 | ||
8 | 7 | 3.7083 | .74861 | .30562 | 2.9227 | 4.4940 | 3.00 | 5.00 | ||
Total | 350 | 3.4686 | .67078 | .03585 | 3.3981 | 3.5391 | 1.00 | 5.00 | ||
Model | Fixed Effects | .65463 | .65463 | .03499 | 3.3997 | 3.5374 | ||||
Random Effects | .13043 | 3.0535 | 3.8836 | .03712 | ||||||
PX | |||
Levene Statistic | df1 | df2 | Sig. |
.745 | 3 | 346 | .526 |
ANOVA
Sum of Squares | df | Mean Square | F | Sig. | |
Between Groups | 8.752 | 3 | 2.917 | 6.808 | .000 |
Within Groups | 148.277 | 346 | .429 | ||
Total | 157.029 | 349 |
PX
Dependent Variable:PX | |||||||
Tukey HSD | (I) Nghe | (J) Nghe | Mean Difference (I-J) | Std. Error | Sig. | 95% Confidence Interval | |
Lower Bound | Upper Bound | ||||||
1 | 2 | -.22073 | .07309 | .014 | -.4094 | -.0321 | |
3 | -.56615 | .14581 | .001 | -.9426 | -.1897 | ||
4 | -.38318 | .27213 | .495 | -1.0857 | .3193 | ||
5 | .22073 | .07309 | .014 | .0321 | .4094 | ||
6 | -.34542 | .14610 | .086 | -.7226 | .0317 | ||
7 | -.16245 | .27228 | .933 | -.8654 | .5405 | ||
8 | .56615 | .14581 | .001 | .1897 | .9426 | ||
12.7. Theo kinh nghiệm sử dụng
PX | |||||||||
N | Mean | Std. Deviation | Std. Error | 95% Confidence Interval for Mean | Minimum | Maximum | Between- Compone nt Variance | ||
Lower Bound | Upper Bound | ||||||||
1 | 30 | 3.4833 | .61214 | .11176 | 3.2548 | 3.7119 | 2.50 | 5.00 | |
2 | 137 | 3.5018 | .63917 | .05461 | 3.3938 | 3.6098 | 1.50 | 5.00 | |
3 | 126 | 3.4087 | .75671 | .06741 | 3.2753 | 3.5421 | 1.00 | 5.00 | |
4 | 57 | 3.5132 | .57169 | .07572 | 3.3615 | 3.6648 | 2.25 | 5.00 | |
Total | 350 | 3.4686 | .67078 | .03585 | 3.3981 | 3.5391 | 1.00 | 5.00 | |
.67213 | .03593 | 3.3979 | 3.5392 | ||||||
.03593 | 3.3542 | 3.5829 | -.00265 | .03712 |