PHỤ LỤC
Kết quả xử lý số liệu bằng phần mềm Stargraphic
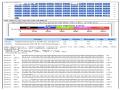
1. Ảnh hưởng pH đến sinh khối nấm Purpureocillium lilacinum
Summary Statistics
Count | Average | Standard deviation | Coeff. of variation | Minimum | Maximu m | Range | Stnd. skewness | |
pH6 | 9 | 1.00877 | 0.204854 | 20.3074% | 0.7486 | 1.2953 | 0.5467 | 0.331128 |
pH6.5 | 9 | 0.99335 6 | 0.31488 | 31.6986% | 0.669 | 1.456 | 0.787 | 0.459758 |
pH7 | 9 | 0.83671 1 | 0.227628 | 27.2051% | 0.5422 | 1.2245 | 0.6823 | 0.386119 |
pH7.5 | 9 | 1.04954 | 0.37276 | 35.5164% | 0.5895 | 1.6044 | 1.0149 | 0.374244 |
Total | 36 | 0.97209 4 | 0.28736 | 29.5609% | 0.5422 | 1.6044 | 1.0622 | 1.15181 |
Có thể bạn quan tâm!
-
 Kết Quả Khảo Sát Khả Năng Kiểm Soát Tuyến Trùng Meloidogyne Sp. Trong Diều Kiện In Vitro
 -
 Ảnh Hưởng Của Ph Lên Sự Hình Thành Số Lượng Bào Tử Nấm Purpureocillium Lilacinum
 -
 Đồ Thị Khảo Sát Ảnh Hưởng Nguồn C Lên Sinh Khối Nấm Purpureocillium Lilacinum
 -
 Nghiên cứu phân lập nấm Purpureocillium Lilacinum để phòng trừ tuyến trùng bướu rễ Meloidogyne SP - 10
Xem toàn bộ 84 trang tài liệu này.
Stnd. kurtosis | |
pH6 | -0.973109 |
pH6.5 | -1.22625 |
pH7 | -0.342502 |
pH7.5 | -1.09884 |
Total | -1.12136 |
ANOVA Table
Sum of Squares | Df | Mean Square | F-Ratio | P-Value | |
Between groups | 0.235116 | 3 | 0.0783721 | 0.94 | 0.4307 |
Within groups | 2.65504 | 32 | 0.0829699 | ||
Total (Corr.) | 2.89015 | 35 |
Multiple Range Tests
Method: 95.0 percent LSD
Count | Mean | Homogeneou s Groups | |
pH7 | 9 | 0.83671 1 | X |
pH6.5 | 9 | 0.99335 6 | X |
pH6 | 9 | 1.00877 | X |
pH7.5 | 9 | 1.04954 | X |
Limits | |||
ph6 - ph6_5 | 0.0154111 | 0.276587 | |
ph6 - ph7 | 0.172056 | 0.276587 | |
ph6 - ph7_5 | - 0.0407778 | 0.276587 | |
ph6_5 - ph7 | 0.156644 | 0.276587 | |
ph6_5 - ph7_5 | - 0.0561889 | 0.276587 | |
ph7 - ph7_5 | -0.212833 | 0.276587 |
Sig. | Difference | +/- |
* denotes a statistically significant difference.
2. Ảnh hưởng pH đến số lượng bào tử nấm Purpureocillium lilacinum
Summary Statistics
Count | Average | Standard deviation | Coeff. of variation | Minimum | Maximu m | Range | |
Số lượng bào tử _pH 6 | 27 | 1.36593E 7 | 1.51168E7 | 110.67% | 2.E6 | 5.16E7 | 4.96E7 |
Số lượng bào tử _pH 6.5 | 27 | 1.06741E 7 | 8.44387E6 | 79.1063% | 2.6E6 | 2.66E7 | 2.4E7 |
Số lượng bào tử _pH 7 | 27 | 1.21481E 7 | 1.20962E7 | 99.5726% | 800000. | 4.6E7 | 4.52E7 |
Số lượng bào tử _pH 7.5 | 27 | 1.24296E 7 | 1.33039E7 | 107.034% | 1.E6 | 4.E7 | 3.9E7 |
Total | 108 | 1.22278E 7 | 1.23512E7 | 101.009% | 800000. | 5.16E7 | 5.08E7 |
Stnd. skewness | Stnd. kurtosis | |
Số lượng bào tử _pH 6 | 3.65545 | 2.06987 |
Số lượng bào tử _pH 6.5 | 2.14632 | -0.679829 |
Số lượng bào tử _pH 7 | 3.01232 | 1.34052 |
Số lượng bào tử _pH 7.5 | 2.11917 | -0.794559 |
Total | 6.30008 | 3.04224 |
ANOVA Table
Sum of Squares | Df | Mean Square | F-Ratio | P-Value | |
Between groups | 1.21776E14 | 3 | 4.0592E13 | 0.26 | 0.8536 |
Within groups | 1.62013E16 | 104 | 1.55782E1 4 | ||
Total (Corr.) | 1.63231E16 | 107 |
Multiple Range Tests
Method: 95.0 percent LSD
Count | Mean | Homogeneous Groups | |
Số lượng bào tử _pH 6.5 | 27 | 1.06741E7 | X |
Số lượng bào tử _pH 7 | 27 | 1.21481E7 | X |
Số lượng bào tử _pH 7.5_ | 27 | 1.24296E7 | X |
Số lượng bào tử _pH 6 | 27 | 1.36593E7 | X |
Sig. | Difference | +/- Limits | |
Số lượng bào tử _pH 6_- Số lượng bào tử _pH 6.5 | 2.98519E 6 | 6.73633E 6 | |
Số lượng bào tử _pH 6- Số lượng bào tử _pH 7 | 1.51111E 6 | 6.73633E 6 | |
Số lượng bào tử _pH 6- Số lượng bào tử _pH 7.5 | 1.22963E 6 | 6.73633E 6 | |
Số lượng bào tử? _pH 6.5- Số lượng bào tử bào t? _pH 7 | - 1.47407E 6 | 6.73633E 6 | |
Số lượng bào tử _pH 6.5 - Số lượng bào tử _pH 7.5 | - 1.75556E 6 | 6.73633E 6 | |
Số lượng bào tử _pH 7 - Số lượng bào tử _pH 7.5 | -281481. | 6.73633E 6 |
* denotes a statistically significant difference.
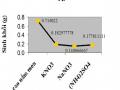
3. Ảnh hưởng của nguồn N đến sinh khối nấm Purpureocillium lilacinum
Summary Statistics
Count | Average | Standard deviation | Coeff. of variation | Minimum | Maximum | Range | Stnd. skewness | |
cao nấm men | 9 | 0.71402 2 | 0.0916788 | 12.8398% | 0.5246 | 0.8193 | 0.2947 | -1.27799 |
(NH4)2SO4 | 9 | 0.17781 1 | 0.0262158 | 14.7436% | 0.1444 | 0.2261 | 0.0817 | 0.582444 |
KNO 3 | 9 | 0.18297 8 | 0.0710664 | 38.8388% | 0.104 | 0.3298 | 0.2258 | 1.5441 |
NaNO3 | 9 | 0.14806 7 | 0.0515726 | 34.8307% | 0.0812 | 0.2445 | 0.1633 | 0.637726 |
Total | 36 | 0.30571 9 | 0.247348 | 80.907% | 0.0812 | 0.8193 | 0.7381 | 2.91598 |
Stnd. kurtosis | |
cao nấm men | 0.699889 |
(NH4)2SO4 | -0.107829 |
KNO3 | 0.740693 |
NaNO3 | -0.0145503 |
Total | -0.381397 |
ANOVA Table
Sum of Squares | Df | Mean Square | F-Ratio | P-Value | |
Between groups | 2.00692 | 3 | 0.668975 | 159.26 | 0.0000 |
Within groups | 0.13442 | 32 | 0.00420061 | ||
Total (Corr.) | 2.14134 | 35 |
Multiple Range Tests
Method: 95.0 percent LSD
Count | Mean | Homogeneous Groups | |
NaNO3 | 9 | 0.14806 7 | X |
(NH4)2SO4 | 9 | 0.17781 1 | X |
KNO3 | 9 | 0.18297 8 | X |
cao nấm men | 9 | 0.71402 2 | X |
Sig. | Difference | +/- Limits | |
cao nấm men - (NH4)2SO4 | * | 0.536211 | 0.062234 |
cao nấm men - KNO3 | * | 0.531044 | 0.062234 |
cao nấm men - NaNO3 | * | 0.565956 | 0.062234 |
(NH4)2SO4- KNO3 | - 0.0051666 7 | 0.062234 | |
(NH4)2SO4- NaNO3 | 0.0297444 | 0.062234 | |
KNO3 - NaNO3 | 0.0349111 | 0.062234 |
* denotes a statistically significant difference.
4. Ảnh hưởng của nguồn N đến số lượng bào tử nấm Purpureocillium lilacinum
Summary Statistics
Count | Average | Standard deviation | Coeff. of variation | Minimum | Maximum | Range | Stnd. skewness | |
cao nấm men | 27 | 3.22222E 6 | 1.41349E6 | 43.8669% | 1.E6 | 5.8E6 | 4.8E6 | 0.268604 |
KNO3 | 27 | 3.52593E 6 | 2.01697E6 | 57.2038% | 800000. | 7.8E6 | 7.E6 | 0.854775 |
NaNO3 | 27 | 3.40741E 6 | 1.67376E6 | 49.1213% | 1.2E6 | 8.E6 | 6.8E6 | 1.58345 |
27 | 814815. | 1.05965E6 | 130.047% | 200000. | 3.8E6 | 3.6E6 | 4.4659 | |
Total | 108 | 2.74259E 6 | 1.92087E6 | 70.0386% | 200000. | 8.E6 | 7.8E6 | 2.0689 |
(NH4)2SO4
Stnd. kurtosis | |
cao nấm men | -1.0372 |
KNO3 | -1.00715 |
NaNO3 | 0.406629 |
(NH4)2SO4 | 3.54731 |
Total | -1.10586 |
ANOVA Table
Sum of Squares | Df | Mean Square | F-Ratio | P-Value | |
Between groups | 1.35053E14 | 3 | 4.50177E1 3 | 18.02 | 0.0000 |
Within groups | 2.59751E14 | 104 | 2.49761E1 2 | ||
Total (Corr.) | 3.94804E14 | 107 |
Multiple Range Tests
Method: 95.0 percent LSD
Count | Mean | Homogeneous Groups | |
(NH4)2SO4 | 27 | 814815. | X |
cao nấm men | 27 | 3.22222E 6 | X |
NaNO3 | 27 | 3.40741E 6 | X |
KNO3 | 27 | 3.52593E 6 | X |
Sig. | Difference | +/- Limits | |
cao nấm men - KNO3 | -303704. | 852957. | |
cao nấm men - NaNO3 | -185185. | 852957. | |
cao nấm men - (NH4)2SO4 | * | 2.40741E6 | 852957. |
KNO3 - NaNO3 | 118519. | 852957. | |
KNO3 - (NH4)2SO4 | * | 2.71111E6 | 852957. |
NaNO3 - | * | 2.59259E6 | 852957. |
(NH4)2SO4
* denotes a statistically significant difference.
5. Ảnh hưởng của nguồn C đến sinh khối nấm Purpureocillium lilacinum
Summary Statistics
Count | Average | Standard deviation | Coeff. of variation | Minimum | Maximum | Range | Stnd. skewness | |
Glucose | 9 | 0.757578 | 0.108659 | 14.343% | 0.632 | 0.9686 | 0.3366 | 1.02536 |
saccharose | 9 | 0.929056 | 0.221359 | 23.8263% | 0.6926 | 1.4147 | 0.7221 | 1.59533 |
tinh bột | 9 | 0.624344 | 0.115439 | 18.4896% | 0.4827 | 0.7597 | 0.277 | -0.261205 |
Total | 27 | 0.770326 | 0.197394 | 25.6248% | 0.4827 | 1.4147 | 0.932 | 2.71398 |
Stnd. kurtosis | |
Glucose | 0.16557 |
saccharose | 1.44244 |
tinh bột | -1.41498 |
Total | 3.37441 |
ANOVA Table
Sum of Squares | Df | Mean Square | F-Ratio | P-Value | |
Between groups | 0.420014 | 2 | 0.210007 | 8.50 | 0.0016 |
Within groups | 0.593063 | 24 | 0.024711 | ||
Total (Corr.) | 1.01308 | 26 |
Multiple Range Tests
Method: 95.0 percent LSD
Count | Mean | Homogeneous Groups | |
tinh bột | 9 | 0.624344 | X |
glucose | 9 | 0.757578 | X |
saccharose | 9 | 0.929056 | X |
Sig. | Difference | +/- Limits | |
glucose - saccharose | * | -0.171478 | 0.152942 |
glucose - tinh bột | 0.133233 | 0.152942 | |
saccharose - tinh bột | * | 0.304711 | 0.152942 |
* denotes a statistically significant difference.
6. Ảnh hưởng của nguồn C đến số lượng bào tử nấm Purpureocillium lilacinum
Summary Statistics
Count | Average | Standard deviation | Coeff. of variation | Minimu m | Maximu m | Range | Stnd. skewness | |
glucose | 27 | 3.22222 E6 | 1.41349E6 | 43.8669% | 1.E6 | 5.8E6 | 4.8E6 | 0.268604 |
saccharose | 27 | 2.42E7 | 7.37397E6 | 30.4709% | 1.14E7 | 3.7E7 | 2.56E7 | 0.377893 |
tinh bột | 27 | 1.27926 E7 | 4.99491E6 | 39.0454% | 4.8E6 | 2.12E7 | 1.64E7 | -0.195049 |
Total | 81 | 1.34049 E7 | 1.0044E7 | 74.9273% | 1.E6 | 3.7E7 | 3.6E7 | 2.31962 |
ANOVA Table
Sum of Squares | Df | Mean Square | F-Ratio | P-Value | |
Between groups | 5.95609E15 | 2 | 2.97805E1 5 | 109.86 | 0.0000 |
Within groups | 2.11439E15 | 78 | 2.71075E1 3 | ||
Total (Corr.) | 8.07048E15 | 80 |
Multiple Range Tests
Method: 95.0 percent LSD
Count | Mean | Homogeneo us Groups | |
glucose | 27 | 3.22222E6 | X |
tinh bột | 27 | 1.27926E7 | X |
saccharose | 27 | 2.42E7 | X |
Sig. | Difference | +/- Limits | |
glucose - saccharose | * | -2.09778E7 | 2.82109E 6 |
glucose - tinh bột | * | -9.57037E6 | 2.82109E 6 |
saccharose - tinh bột | * | 1.14074E7 | 2.82109E 6 |
* denotes a statistically significant difference.
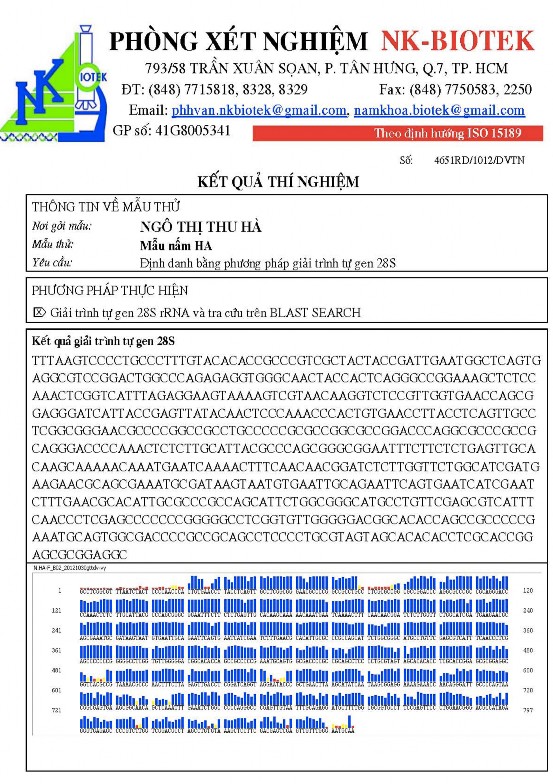
7. Kết quả định danh nấm Purpureocillium lilacinum