N of Items | |
0.629 | 3 |
Có thể bạn quan tâm!
-

 Hạn Chế Của Đề Tài Và Hướng Nghiên Cứu Tiếp Theo
 -
 Theo Chuyên Gia Các Nhân Tố Nào Dưới Đây Ảnh Hưởng Đến Tổ Chức Hệ Thống Thông Tin Kế Toán Tại Các Đơn Vị Sử Dụng Ngân Sách Nhà Nước Trên Địa
 -
 Nâng cao hiệu quả tổ chức hệ thống thông tin kế toán tại các đơn vị sử dụng ngân sách nhà nước trên địa bàn huyện Bắc Tân Uyên, Bình Dương - 13
 -
 Nâng cao hiệu quả tổ chức hệ thống thông tin kế toán tại các đơn vị sử dụng ngân sách nhà nước trên địa bàn huyện Bắc Tân Uyên, Bình Dương - 15
 -
 Nâng cao hiệu quả tổ chức hệ thống thông tin kế toán tại các đơn vị sử dụng ngân sách nhà nước trên địa bàn huyện Bắc Tân Uyên, Bình Dương - 16
Xem toàn bộ 129 trang tài liệu này.
Item-Total Statistics
Scale Variance if Item Deleted | Corrected Item-Total Correlation | Cronbach's Alpha if Item Deleted | ||
CLDL1 | 6.89 | 2.176 | 0.413 | 0.564 |
CLDL2 CLDL3 | 6.99 | 2.012 | 0.507 | 0.430 |
7.08 | 2.233 | 0.396 | 0.588 |
Reliability Statistics
N of Items | |
0.769 | 3 |
Item-Total Statistics
Scale Variance if Item Deleted | Corrected Item-Total Correlation | Cronbach's Alpha if Item Deleted | ||
DTBD1 | 6.94 | 1.631 | 0.555 | 0.747 |
DTBD2 | 7.32 | 1.602 | 0.592 | 0.703 |
DTBD3 | 7.12 | 1.728 | 0.676 | 0.622 |
Reliability Statistics
N of Items | |
0.791 | 4 |
Item-Total Statistics
Scale Variance if Item Deleted | Corrected Item-Total Correlation | Cronbach's Alpha if Item Deleted | ||
KSNB1 | 10.94 | 5.135 | 0.612 | 0.733 |
KSNB2 | 10.98 | 5.069 | 0.596 | 0.741 |
KSNB3 | 11.01 | 5.082 | 0.615 | 0.732 |
KSNB4 | 10.96 | 5.319 | 0.576 | 0.751 |
Reliability Statistics
N of Items | |
0.671 | 3 |
Item-Total Statistics
Scale Variance if Item Deleted | Corrected Item-Total Correlation | Cronbach's Alpha if Item Deleted | ||
HTTTKT1 | 7.75 | 1.421 | 0.524 | 0.523 |
HTTTKT2 | 7.52 | 1.459 | 0.472 | 0.590 |
HTTTKT3 | 7.56 | 1.443 | 0.455 | 0.615 |
KMO and Bartlett's Test
0.710
1193.272
190
0.000
Kaiser-Meyer-Olkin Measure of Sampling
Adequacy. Bartlett's Test of Sphericity Approx.
Chi-
Square
df Sig.
Total Variance Explained
Extraction Sums of Squared Loadings Total | % of Variance | Cumulative % | Rotation Sums of Squared Loadings Total | % of Variance | Cumulative % | ||||
Total | % of Variance | Cumulative % | |||||||
1 | 4.125 | 20.627 | 20.627 | 4.125 | 20.627 | 20.627 | 2.547 | 12.736 | 12.736 |
2 | 3.037 | 15.183 | 35.810 | 3.037 | 15.183 | 35.810 | 2.512 | 12.560 | 25.296 |
3 | 2.497 | 12.484 | 48.294 | 2.497 | 12.484 | 48.294 | 2.451 | 12.257 | 37.553 |
4 | 1.453 | 7.263 | 55.557 | 1.453 | 7.263 | 55.557 | 2.120 | 10.600 | 48.153 |
5 | 1.240 | 6.200 | 61.757 | 1.240 | 6.200 | 61.757 | 2.034 | 10.172 | 58.325 |
6 | 1.173 | 5.863 | 67.620 | 1.173 | 5.863 | 67.620 | 1.859 | 9.295 | 67.620 |
7 | 0.822 | 4.110 | 71.729 | ||||||
8 | 0.691 | 3.457 | 75.186 | ||||||
9 | 0.677 | 3.384 | 78.570 | ||||||
10 | 0.647 | 3.237 | 81.807 | ||||||
11 12 | 0.525 | 2.626 | 84.433 | ||||||
0.493 | 2.465 | 86.898 | |||||||
13 | 0.458 | 2.289 | 89.187 | ||||||
14 | 0.436 | 2.182 | 91.370 | ||||||
15 | 0.390 | 1.950 | 93.320 | ||||||
16 | 0.358 | 1.789 | 95.109 | ||||||
17 | 0.327 | 1.633 | 96.742 | ||||||
18 | 0.262 | 1.311 | 98.053 | ||||||
1.094 | 99.148 | |||||||
20 0.170 | 0.852 | 100.000 |
Extraction Method: Principal Component Analysis.
Rotated Component Matrixa
Component
2 | 3 | 4 | 5 | 6 | ||
HTPL3 HTPL4 | 0.817 | |||||
0.814 | ||||||
HTPL1 | 0.768 | |||||
HTPL2 | 0.747 | |||||
KSNB4 | 0.829 | |||||
KSNB1 | 0.801 | |||||
KSNB3 | 0.725 | |||||
KSNB2 KNPM2 | 0.686 | |||||
0.865 | ||||||
KNPM1 | 0.757 | |||||
KNPM3 | 0.731 | |||||
TDQL1 TDQL2 | 0.848 | |||||
0.744 | ||||||
TDQL3 | 0.670 | |||||
DTBD3 | 0.818 | |||||
DTBD2 | 0.776 | |||||
DTBD1 | 0.671 | |||||
CLDL3 | 0.774 | |||||
CLDL2 CLDL1 | 0.736 | |||||
0.666 |
Extraction Method: Principal Component Analysis. Rotation Method: Varimax with Kaiser Normalization.
a. Rotation converged in 6 iterations.
KMO and Bartlett's Test
0.656 | |
Bartlett's Test of Sphericity Approx. Chi- Square | 71.736 |
df | 3 |
Sig. | 0.000 |
Total Variance Explained
Extraction Sums of Squared
Component Initial Eigenvalues Loadings
% of Variance | Cumulative % | Total | % of Variance | Cumulative % | ||
1 | 1.813 | 60.426 | 60.426 | 1.813 | 60.426 | 60.426 |
2 | 0.647 | 21.579 | 82.005 | |||
3 | 0.540 | 17.995 | 100.000 |
Extraction Method: Principal Component Analysis.
Component Matrixa
HTTTKT1 HTTTKT2 | 0.809 |
0.770 | |
HTTTKT3 | 0.753 |
Component 1
Extraction Method: Principal Component Analysis.
a. 1 components extracted.
Correlations
TDQL | KNPM | CLDL | DTBD | KSNB | HTTTKT | ||
HTPL Pearson Correlation | 1 | 0.118 | -0.031 | 0.001 | - 0.016 | .434** | .250** |
Sig. (2- tailed) | 0.137 | 0.695 | 0.985 | 0.838 | 0.000 | 0.001 | |
N | 160 | 160 | 160 | 160 | 160 | 160 | 160 |
TDQL Pearson Correlation | 0.118 | 1 | .420** | .185* | .171* | 0.008 | .589** |
Sig. (2- tailed) | 0.137 | 0.000 | 0.019 | 0.031 | 0.919 | 0.000 | |
N | 160 | 160 | 160 | 160 | 160 | 160 | 160 |
KNPM Pearson Correlation | - 0.031 | .420** | 1 | 0.087 | .183* | 0.117 | .539** |
Sig. (2- tailed) | 0.695 | 0.000 | 0.272 | 0.020 | 0.140 | 0.000 | |
N | 160 | 160 | 160 | 160 | 160 | 160 | 160 |
CLDL Pearson Correlation | 0.001 | .185* | 0.087 | 1 | - 0.002 | 0.009 | .351** |
Sig. (2- tailed) | 0.985 | 0.019 | 0.272 | 0.980 | 0.909 | 0.000 | |
N | 160 | 160 | 160 | 160 | 160 | 160 | 160 |
DTBD Pearson Correlation | - 0.016 | .171* | .183* | - 0.002 | 1 | 0.081 | .317** |
Sig. (2- tailed) | 0.838 | 0.031 | 0.020 | 0.980 | 0.309 | 0.000 | |
N | 160 | 160 | 160 | 160 | 160 | 160 | 160 |
KSNB Pearson Correlation | .434** | 0.008 | 0.117 | 0.009 | 0.081 | 1 | .284** |
Sig. (2- tailed) | 0.000 | 0.919 | 0.140 | 0.909 | 0.309 | 0.000 | |
N | 160 | 160 | 160 | 160 | 160 | 160 | 160 |
HTTTKT Pearson Correlation | .250** | .589** | .539** | .351** | .317** | .284** | 1 |
0.000 | 0.000 | 0.000 | 0.000 | 0.000 | ||
N 160 | 160 | 160 | 160 | 160 | 160 | 160 |
**. Correlation is significant at the 0.01 level (2- tailed).
*. Correlation is significant at the 0.05 level (2- tailed).
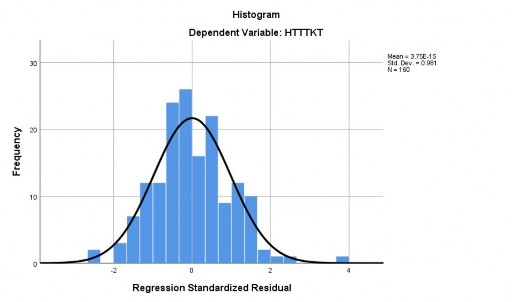
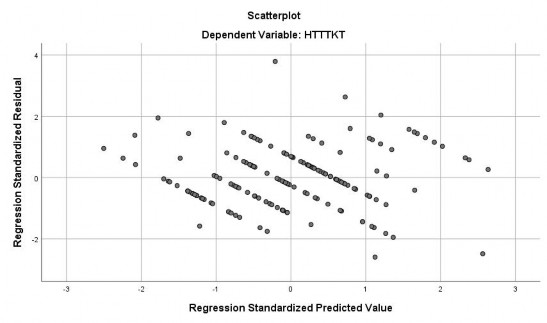
Model Summaryb
R Square | Adjusted R Square | Std. Error of the Estimate | Change Statistics R Square Change | F Change | df1 | df2 | Sig. F Change | Durbin- Watson | ||
1 | .784a | 0.614 | 0.599 | 0.35239 | 0.614 | 40.631 | 6 | 153 | 0.000 | 2.120 |
a. Predictors: (Constant), KSNB, TDQL, CLDL, DTBD, KNPM, HLPL
b. Dependent Variable: HTTTKT
ANOVAa
df | Mean Square | F | Sig. | ||
1 Regression | 30.272 | 6 | 5.045 | 40.631 | .000b |
Residual | 18.999 | 153 | 0.124 | ||
Total | 49.272 | 159 |
a. Dependent Variable: HTTTKT
b. Predictors: (Constant), KSNB, TDQL, CLDL, DTBD, KNPM, HLPL
Coefficientsa
Standardized Coefficients Beta | t | Sig. | Correlations Zero-order | Partial | Part | Collinearity Statistics Tolerance | VIF | ||||
1 | (Constant) | - | 0.300 | -1.885 | 0.061 | ||||||
0.565 | |||||||||||
HTPL | 0.114 | 0.043 | 0.150 | 2.632 | 0.009 | 0.250 | 0.208 | 0.132 | 0.774 | 1.293 | |
TDQL | 0.303 | 0.049 | 0.358 | 6.210 | 0.000 | 0.589 | 0.449 | 0.312 | 0.760 | 1.315 | |
KNPM | 0.287 | 0.051 | 0.317 | 5.582 | 0.000 | 0.539 | 0.411 | 0.280 | 0.781 | 1.281 | |
CLDL | 0.227 | 0.045 | 0.256 | 5.003 | 0.000 | 0.351 | 0.375 | 0.251 | 0.963 | 1.038 | |
DTBD | 0.159 | 0.044 | 0.188 | 3.643 | 0.000 | 0.317 | 0.283 | 0.183 | 0.946 | 1.057 | |
KSNB | 0.127 | 0.045 | 0.161 | 2.829 | 0.005 | 0.284 | 0.223 | 0.142 | 0.776 | 1.289 | |
a. Dependent Variable: HTTTKT