PHỤ LỤC 3
Phân tích nhân tố các biến độc lập
Kaiser-Meyer-Olkin Measure of Sampling Adequacy. | .721 | |
Bartlett's Test of Sphericity | Approx. Chi-Square | 4340.041 |
df | 300 | |
Sig. | .000 | |
Có thể bạn quan tâm!
-
 Mức Độ Hài Lòng Của Khách Hàng Về Yếu Tố Khả Năng Đáp Ứng
 -
 Theo Anh/ Chị, Ngoài Các Yếu Tố Trên Còn Có Các Yếu Tố Nào Khác Ảnh Hưởng Đến Chất Lượng Dịch Vụ Du Lịch Tại Công Ty Cổ Phần Dịch Vụ Du Lịch
 -
 Đo lường sự hài lòng của khách hàng khi sử dụng dịch vụ du lịch tại Công ty cổ phần dịch vụ du lịch Bến Thành - 14
Xem toàn bộ 124 trang tài liệu này.
Communalities
Initial | Extraction | |
TC1 | 1.000 | .801 |
TC2 | 1.000 | .658 |
TC3 | 1.000 | .666 |
TC4 | 1.000 | .810 |
TC5 | 1.000 | .712 |
DU1 | 1.000 | .786 |
DU2 | 1.000 | .698 |
DU4 | 1.000 | .692 |
DU5 | 1.000 | .730 |
PV1 | 1.000 | .784 |
PV2 | 1.000 | .777 |
PV3 | 1.000 | .568 |
PV4 | 1.000 | .647 |
DC1 | 1.000 | .744 |
DC2 | 1.000 | .783 |
DC4 | 1.000 | .611 |
DC5 | 1.000 | .545 |
HH1 | 1.000 | .798 |
HH2 | 1.000 | .777 |
HH3 | 1.000 | .751 |
HH5 | 1.000 | .778 |
GC1 | 1.000 | .770 |
GC2 | 1.000 | .659 |
GC4 | 1.000 | .703 |
GC5 | 1.000 | .577 |
Extraction Method: Principal Component Analysis.
Total Variance Explained
Initial Eigenvalues | Extraction Sums of Squared Loadings | Rotation Sums of Squared Loadings | ||||||||
Total | % of Variance | Cumulative % | Total | % of Variance | Cumulative % | Total | % of Variance | Cumulativ e % | ||
1 | 4.034 | 16.134 | 16.134 | 4.034 | 16.134 | 16.134 | 3.578 | 14.311 | 14.311 | |
2 | 3.401 | 13.602 | 29.737 | 3.401 | 13.602 | 29.737 | 3.088 | 12.354 | 26.664 | |
3 | 3.190 | 12.760 | 42.496 | 3.190 | 12.760 | 42.496 | 2.949 | 11.796 | 38.460 | |
4 | 2.716 | 10.863 | 53.359 | 2.716 | 10.863 | 53.359 | 2.785 | 11.139 | 49.599 | |
5 | 2.298 | 9.192 | 62.551 | 2.298 | 9.192 | 62.551 | 2.715 | 10.862 | 60.461 | |
6 | 2.189 | 8.757 | 71.309 | 2.189 | 8.757 | 71.309 | 2.712 | 10.847 | 71.309 | |
7 | .782 | 3.128 | 74.436 | |||||||
8 | .677 | 2.708 | 77.144 | |||||||
9 | .667 | 2.669 | 79.813 | |||||||
10 | .609 | 2.435 | 82.248 | |||||||
11 | .501 | 2.002 | 84.251 | |||||||
12 | .489 | 1.957 | 86.207 | |||||||
13 | .429 | 1.718 | 87.925 | |||||||
dim ensi on0 | 14 | .419 | 1.674 | 89.599 | ||||||
15 | .376 | 1.502 | 91.102 | |||||||
16 | .322 | 1.287 | 92.389 | |||||||
17 | .305 | 1.219 | 93.607 | |||||||
18 | .284 | 1.137 | 94.745 | |||||||
19 | .271 | 1.084 | 95.829 | |||||||
20 | .239 | .954 | 96.783 | |||||||
21 | .216 | .863 | 97.646 | |||||||
22 | .195 | .781 | 98.427 | |||||||
23 | .154 | .615 | 99.042 | |||||||
24 | .138 | .551 | 99.593 | |||||||
25 | .102 | .407 | 100.000 |
Extraction Method: Principal Component Analysis.
Component | ||||||
1 | 2 | 3 | 4 | 5 | 6 | |
TC4 | .882 | |||||
TC1 | .879 | |||||
TC5 | .832 | |||||
TC3 | .800 | |||||
TC2 | .792 | |||||
HH1 | .877 | |||||
HH2 | .870 | |||||
HH5 | .869 | |||||
HH3 | .861 | |||||
DU1 | .879 | |||||
DU5 | .840 | |||||
DU2 | .830 | |||||
DU4 | .797 | |||||
PV2 | .869 | |||||
PV1 | .862 | |||||
PV4 | .795 | |||||
PV3 | .733 | |||||
DC2 | .868 | |||||
DC1 | .857 | |||||
DC4 | .755 | |||||
DC5 | .732 | |||||
GC1 | .851 | |||||
GC4 | .831 | |||||
GC2 | .797 | |||||
GC5 | .754 |
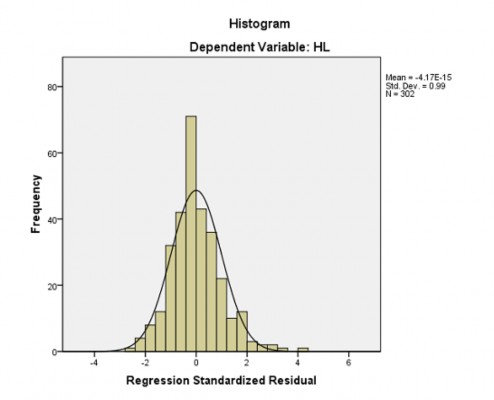
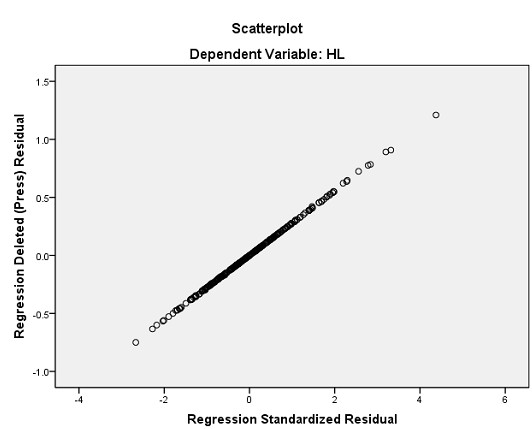
Phụ lục: Phân tích hồi quy
Correlations
HL | TC | HH | DU | PV | DC | GC | ||
Pearson Correlation | HL | 1.000 | .335 | .417 | .265 | .336 | .292 | .301 |
TC | .335 | 1.000 | -.050 | -.132 | -.008 | -.005 | .093 | |
HH | .417 | -.050 | 1.000 | .000 | .093 | .061 | .125 | |
DU | .265 | -.132 | .000 | 1.000 | .152 | .024 | -.067 | |
PV | .336 | -.008 | .093 | .152 | 1.000 | .128 | -.023 | |
DC | .292 | -.005 | .061 | .024 | .128 | 1.000 | -.091 | |
GC | .301 | .093 | .125 | -.067 | -.023 | -.091 | 1.000 | |
Sig. (1-tailed) | HL | . | .000 | .000 | .000 | .000 | .000 | .000 |
TC | .000 | . | .191 | .011 | .447 | .465 | .053 | |
HH | .000 | .191 | . | .498 | .053 | .147 | .015 | |
DU | .000 | .011 | .498 | . | .004 | .339 | .125 | |
PV | .000 | .447 | .053 | .004 | . | .013 | .347 | |
DC | .000 | .465 | .147 | .339 | .013 | . | .057 | |
GC | .000 | .053 | .015 | .125 | .347 | .057 | . | |
N | HL | 302 | 302 | 302 | 302 | 302 | 302 | 302 |
TC | 302 | 302 | 302 | 302 | 302 | 302 | 302 | |
HH | 302 | 302 | 302 | 302 | 302 | 302 | 302 | |
DU | 302 | 302 | 302 | 302 | 302 | 302 | 302 | |
PV | 302 | 302 | 302 | 302 | 302 | 302 | 302 | |
DC | 302 | 302 | 302 | 302 | 302 | 302 | 302 |
HL | TC | HH | DU | PV | DC | GC | ||
Pearson Correlation | HL | 1.000 | .335 | .417 | .265 | .336 | .292 | .301 |
TC | .335 | 1.000 | -.050 | -.132 | -.008 | -.005 | .093 | |
HH | .417 | -.050 | 1.000 | .000 | .093 | .061 | .125 | |
DU | .265 | -.132 | .000 | 1.000 | .152 | .024 | -.067 | |
PV | .336 | -.008 | .093 | .152 | 1.000 | .128 | -.023 | |
DC | .292 | -.005 | .061 | .024 | .128 | 1.000 | -.091 | |
GC | .301 | .093 | .125 | -.067 | -.023 | -.091 | 1.000 | |
Sig. (1-tailed) | HL | . | .000 | .000 | .000 | .000 | .000 | .000 |
TC | .000 | . | .191 | .011 | .447 | .465 | .053 | |
HH | .000 | .191 | . | .498 | .053 | .147 | .015 | |
DU | .000 | .011 | .498 | . | .004 | .339 | .125 | |
PV | .000 | .447 | .053 | .004 | . | .013 | .347 | |
DC | .000 | .465 | .147 | .339 | .013 | . | .057 | |
GC | .000 | .053 | .015 | .125 | .347 | .057 | . | |
N | HL | 302 | 302 | 302 | 302 | 302 | 302 | 302 |
TC | 302 | 302 | 302 | 302 | 302 | 302 | 302 | |
HH | 302 | 302 | 302 | 302 | 302 | 302 | 302 | |
DU | 302 | 302 | 302 | 302 | 302 | 302 | 302 | |
PV | 302 | 302 | 302 | 302 | 302 | 302 | 302 | |
DC | 302 | 302 | 302 | 302 | 302 | 302 | 302 | |
GC | 302 | 302 | 302 | 302 | 302 | 302 | 302 | |
Model Summaryb
R | R Square | Adjusted R Square | Std. Error of the Estimate | Durbin-Watson | |
1 | .767a | .588 | .579 | .27099 | 2.076 |
a. Predictors: (Constant), GC, PV, TC, DC, HH, DU
b. Dependent Variable: HL
ANOVAb
Sum of Squares | df | Mean Square | F | Sig. | ||
1 | Regression | 30.873 | 6 | 5.146 | 70.067 | .000a |
Residual | 21.664 | 295 | .073 | |||
Total | 52.537 | 301 |
a. Predictors: (Constant), GC, PV, TC, DC, HH, DU
b. Dependent Variable: HL
Unstandardized Coefficients | Standardized Coefficients | t | Sig. | Collinearity Statistics | ||||
B | Std. Error | Beta | Tolerance | VIF | ||||
1 | (Constant) | .190 | .193 | .985 | .326 | |||
TC | .197 | .020 | .370 | 9.746 | .000 | .971 | 1.030 | |
HH | .179 | .019 | .364 | 9.584 | .000 | .967 | 1.034 | |
DU | .152 | .020 | .290 | 7.582 | .000 | .957 | 1.045 | |
PV | .159 | .026 | .233 | 6.092 | .000 | .954 | 1.049 | |
DC | .180 | .026 | .260 | 6.855 | .000 | .972 | 1.029 | |
GC | .154 | .022 | .269 | 7.054 | .000 | .962 | 1.040 |
Model
a. Dependent Variable: HL


