J. W., Stanisiewski E. P. and Tucher H. A. (1997), “Effects of diet and injection of bovine somatropin on heifer growth and mammary development”, Journal of Dairy Science, 80, pp. 1996
– 2003.
171 Radcliff R. P., Vandehaar M. J., Chapin L. T., Pilbeam T. E., Beede
D. K., Stanisiewski E. P. and Tucher H. A. (2000), “Effects of diet and injection of bovine somatropin on prepubertal growth and Firstlactation milk yields of Holstein cows”, Journal of Dairy Science, 83, pp. 23 – 29.
172 Resendiz Juarez M E. and Bernal Santos M. G. (1999), “Productive performance of dairy primiparous cows fed protected fat”, Agrociencia, 9. 33 (4), CD Vol. 258, pp. 445 – 449.
173 Richards F. J (1959), “A flexible growth function for empirical use”,
J. Exp. Bot, Vol. 10, pp. 290 - 300.
174 Richard S. Adams (1998), “Reducing heat stress on dairy cows”,
http://www.penpages.psu.edu/penpagesreferense/28902/, pp. 1 – 3.
175 Safi Jahanshahi A., Vaez Torshizi R., Kashan N. E. J. and Sayyad Nejad M. B. (2002), “Genetic parameters for milk production traits of Iran Holsteins”, Proc. 7th World congress on genetics applied to livestock production, August 19 – 23, Montpellier, France
176 Sawal R. K. and Kurar C. K. (1998), “Milk yield and its fat content as affected by dietary factors”, Asian – Australasian Journal of Animal Sciences, 11 (3), CD Vol. 222, pp. 217 – 233.
177 Saun R. J. and Van Sniffen C. J. (1996), “Nutritional management of the pregnant dairy cow to optimize health, lactation and reproductive performance”, Animal Feed Science and Technology, Vol. 136, pp. 13 – 26.
178 Schahidi R., Kamangar D. H., Khawari H. and Hovareshli P. (1994), “Investigation on milk production of sarabi and mazandarani breeds up graded with Holstein bulls”, Proceedings of the 7th AAAP Animal Science Congress, Vol. 2, pp. 199 – 200.
179 Schingoethe D. J. (1996), “Dietary influence on protein level in milk and milk yield in dairy cows”, Animal Feed Science and Technology, 1996, CD Vol. 136, pp. 181 – 190.
180 Schroeder G. F. and Titgemeyer E. C. (2008), “Interaction between protein and energy supply on protein utilization in growing cattle: A review”, Livestock Science, Vol. 114, Issue 1, pp. 1 – 10.
181 Schwab C. G. (1996), “Rumen-protected amino acids for dairy cattle: progress towards determining lysine and methionine requirements”, Animal Feed Science and Technology, 59 (1/3), CD Vol. 136, pp. 87 – 101.
182 Sengül T., and Kiraz S. (2005), “Non-linear models for growth curves in large white turkeys”, Turkey Journal of Veterinary Animal Science, 29, pp. 331 – 337.
183 Singh S. R., Mishra H. R. and R. S. (1986), “Economcs of milk production of crossbred cows in the plateau of Chotanagpur”, Indian Journal of Dairy Science, 30, 3, pp. 210 – 214.
184 Srikandakumar A. and John. E . H (2004), “The effects of heats stress on milk protein fraction”, Journal of Dairy Science, 57, pp. 281 – 300.
185 Stockdale C. R. (1997), “Influence of energy and protein supplements on the productivity of dairy cows grazing white clover swards in spring”, Australian Journal of Experimental Agriculture, ISSN: 0816-1089, CD Vol. 174, pp. 151 – 157.
186 Tajane K. R., Rai A. V. and Lokanath G. H. (1989), “Relative importance of various factors affecting milk production traits in Hostein Friesian x Sahiwal crossbreds”, Indian Journal of Dairy Science, 42: 1, pp. 78 -79.
187 Takma C., Özkan S. and Akbas Y. (2005), Describing growth curve of turkey toms using Gompertz model, http://ziraat.ege.edu.tr/~yakbas/
188 Tekerli M. and Akinci Z. (2000), “Factors Affecting the Shape of Lactation Curves of Holstein Cows from the Balikesir Province of Turkey”, Journal of Dairy Science, Vol. 83, No. 6, pp. 1381 – 1386 .
189 Nguyen Van Thuong, Nguyen Van Duc and Hoang Thi Thien Huong (2008), “Result of assessment, classification and first stepof establishment of open nucleous breeding system on holstein friesian raising in Moc Chau - Son La”, Report at the 13th AAAP Animal Science Congress, Hà Nội.
190 Uchida K., Mandebvu P., Mandebvu P., Ballard C. S., Sniffen C. J. and Carter M. P. (2001), “Effect of feeding a combination of zinc, manganese and copper amino acid complexes, and cobalt glucoheptonate on performance of early lactation high producing dairy cows”, Animal Feed Science and Technology, 93, CD Vol. 356, pp. 193 – 203.
191 Val-Arreola D., Kebreab E. and France J. (2004), “Study of the Lactation Curve in Dairy Cattle on Farms in Central Mexico”, Journal of Dairy Science, Vol. 87(11), pp. 3789 – 3799.
192 Vande Haar M. J., Yousif G., Sharma B. K., Herdt T. H., Emery R. S., Allen M. S. and Liesman J. S. (1999), “Effect of energy and protein density of prepartum diets on fat and protein metabolism of dairy cattle in the periparturient period”, Journal of Dairy Science, CD Vol. 291, pp. 1282 – 1295.
193 Varga G. A. and Vallimont J. E. (2000), “Protein, energy needs of the dry cow explored”, Feedstuffs, 2000, CD Vol. 300, pp. 12 – 16.
194 Verhulst P. F. (1838), Notice sur laloi que la population suit dans son accroissement, Corr. Math. Phys, pp. 113 – 121.
195 Ware G.O., Phillips R. D., Parrish R. S. and Moon L. C. (1980), “A comparison of two nonlinear models for describing intake- response relationships in highter organisms”, Journal of Nurtition, Maryland, Vol. 110, pp. 765 – 770.
196 Webster Jonh (1987), Understanding the dairy cow, B.S.P. professional book, pp. 8 – 9, 21, 119.
197 Weller J. I., Ezra E. and Leitner G. (2006), “Genetics Analysis of Persistency in th Israeli Holstein Population by the Multitrait Animal Model”, Journal of Dairy Science, 89 (7), pp. 2738 – 2746.
198 Williamson G. and Payner W. J. A., (1978), An introduction to animal husbandry in the tropics, Third edition, Longman, London and Newyork, pp. 210 – 215.
199 Wurzinger M., Delgado J., Nürnberg M., Valle Zarate A., Stemmer A., Ugarte G., and Sölkner J. (2005), “Growth curves and genetic parameters for growth traits in Bolivian llamas”, Livestock Production Science, 95, pp. 73 – 81.
PHỤ LỤC
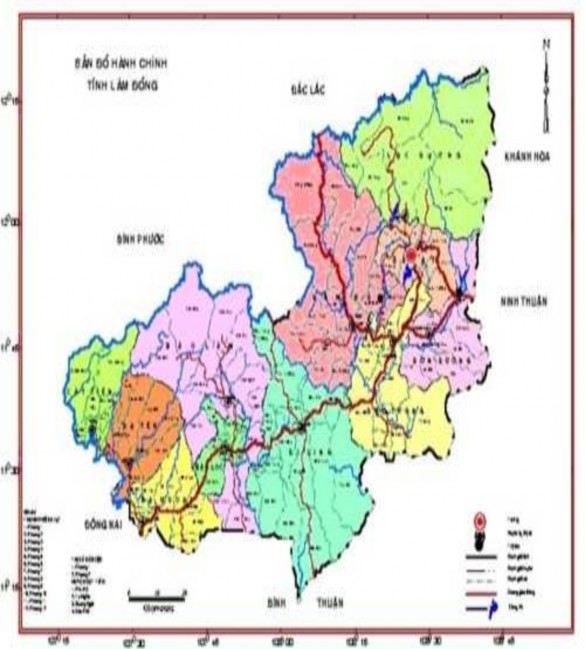
1 BẢN ĐỒ HÀNH CHÍNH TỈNH LÂM ĐỒNG
Bảng 1. Nhiệt độ trung bình tỉnh Lâm Đồng từ năm 2000 – 2008 (0C)
2000 | 2001 | 2002 | 2003 | 2004 | 2005 | 2006 | 2007 | 2008 | |
1 | 18,63 | 18,60 | 17,97 | 18,33 | 18,93 | 18,17 | 19,10 | 18,50 | 19,35 |
2 | 19,70 | 19,25 | 19,07 | 19,70 | 19,53 | 19,53 | 20,10 | 19,10 | 19,50 |
3 | 20,17 | 20,41 | 21,00 | 20,27 | 20,77 | 20,63 | 21,00 | 20,30 | 21,50 |
4 | 21,20 | 21,73 | 21,40 | 22,13 | 21,80 | 21,87 | 21,87 | 21,90 | 21,30 |
5 | 21,43 | 21,72 | 22,27 | 21,67 | 21,73 | 22,10 | 21,90 | 20,75 | 20,47 |
6 | 20,97 | 20,70 | 21,47 | 21,60 | 20,80 | 22,03 | 21,73 | 21,05 | 21,50 |
7 | 20,37 | 20,10 | 21,07 | 20,90 | 20,73 | 20,87 | 21,03 | 20,90 | 20,00 |
8 | 20,77 | 20,62 | 20,30 | 21,07 | 20,43 | 20,90 | 20,87 | 20,45 | 21,45 |
9 | 20,57 | 20,67 | 20,53 | 20,73 | 20,87 | 20,83 | 21,17 | 20,70 | 20,25 |
10 | 20,27 | 20,42 | 20,83 | 20,30 | 20,00 | 20,73 | 20,40 | 20,65 | 21,74 |
11 | 19,70 | 19,94 | 20,23 | 20,00 | 20,00 | 19,80 | 20,40 | 19,95 | 19,38 |
12 | 19,50 | 19,65 | 19,87 | 18,03 | 18,33 | 19,17 | 19,10 | 18,65 | 19,76 |
Cả năm | 20,27 | 20,32 | 20,50 | 20,39 | 20,33 | 20,55 | 20,72 | 20,24 | 20,52 |
Có thể bạn quan tâm!
-

 Nghiên cứu khả năng sinh trưởng, sinh sản, năng suất và chất lượng sữa của bò cái holstein friesian HF thuần, các thế hệ lai F1, F2 và F3 giữa HF và lai sind nuôi tại tỉnh Lâm Đồng - 18
 -
 Trần Quang Hân (1996), Nghiên Cứu Các Tính Trạng Năng Suất Chủ Yếu Của Lợn Trắng Phú Khánh Và Lợn Lai F1 Yorkshire Trắng Phú Khánh, Luận Án Phó Tiến Sỹ Khoa
 -
 Djiko Soetrisno And Mahyuddin M. D. (1994), “Effect Of Graizing Systems On Reproductive Performance And The Net Return Of Milk Yielded By Shiwal – Friesian (Fs) Cows”, Proceeding Of The 7Th
 -
 Nghiên cứu khả năng sinh trưởng, sinh sản, năng suất và chất lượng sữa của bò cái holstein friesian HF thuần, các thế hệ lai F1, F2 và F3 giữa HF và lai sind nuôi tại tỉnh Lâm Đồng - 22
 -
 Nghiên cứu khả năng sinh trưởng, sinh sản, năng suất và chất lượng sữa của bò cái holstein friesian HF thuần, các thế hệ lai F1, F2 và F3 giữa HF và lai sind nuôi tại tỉnh Lâm Đồng - 23
Xem toàn bộ 186 trang tài liệu này.
(Nguồn: Cục Thống kê tỉnh Lâm Đồng, Niên giám thống kê 2000 - 2008)[10]
2 THÀNH PHẦN HOÁ HỌC CỦA THỨC ĂN BÒ NUÔI THÍ NGHIỆM
Bảng 2. Thành phần hoá học của thức ăn
Thức ăn | DM | CP | ME (Kcal) | |
1 | Cỏ voi | 16,02 | 1,98 | 366,07 |
2 | Cỏ tự nhiên | 26,03 | 2,21 | 566,03 |
3 | Rỉ mật | 78,00 | 11 | 2120 |
4 | Bột ngô | 87,7 | 9,12 | 2993 |
5 | Bột sắn | 89,1 | 3,27 | 2902 |
6 | Đỗ tương | 90,40 | 37,30 | 3180 |
7 | Cám gạo 1 | 87,5 | 13,0 | 2555 |
8 | Khô dầu lạc | 89,33 | 38,84 | 3000 |
9 | Khô dầu bông | 90,83 | 37,75 | 2740 |
10 | Bột cá | 89,02 | 52,8 | 2597 |
Nguồn: Thành phần và giá trị dinh dưỡng thức ăn gia súc – gia cầm Việt Nam (Viện Chăn nuôi Quốc gia, 1995)
3 NĂNG SUẤT SỮA (KG) THEO TUẦN CỦA CÁC NHÓM BÒ THEO DÕI VÀ NUÔI THÍ NGHIỆM
Bảng 3. Năng suất sữa theo tuần (số liệu theo dõi)
bò | 1 | 2 | 3 | 4 | 5 | 6 | 7 | 8 | 9 | 10 |
F1 | 112,20 | 108,10 | 122,40 | 121,10 | 124,30 | 135,50 | 126,80 | 127,20 | 125,10 | 126,10 |
F2 | 123,60 | 133,70 | 131,80 | 129,80 | 144,00 | 133,80 | 138,40 | 143,20 | 135,90 | 139,20 |
F3 | 144,50 | 151,90 | 153,80 | 153,10 | 158,70 | 153,40 | 164,10 | 159,70 | 148,70 | 151,20 |
HF | 152,30 | 160,90 | 163,00 | 170,00 | 166,50 | 176,60 | 166,20 | 181,00 | 164,50 | 169,30 |
11 | 12 | 13 | 14 | 15 | 16 | 17 | 18 | 19 | 20 | |
F1 | 124,00 | 128,00 | 109,70 | 122,20 | 121,20 | 109,70 | 99,00 | 105,90 | 107,30 | 101,10 |
F2 | 125,40 | 133,50 | 131,30 | 133,60 | 119,30 | 121,90 | 117,10 | 121,70 | 108,80 | 114,70 |
F3 | 154,40 | 150,90 | 142,30 | 141,80 | 139,00 | 135,50 | 133,30 | 135,10 | 124,00 | 129,60 |
HF | 170,90 | 165,00 | 148,70 | 149,40 | 163,10 | 162,40 | 148,50 | 151,50 | 146,10 | 139,60 |
21 | 22 | 23 | 24 | 25 | 26 | 27 | 28 | 29 | 30 | |
F1 | 95,60 | 93,50 | 93,50 | 93,90 | 87,70 | 93,90 | 88,70 | 85,80 | 80,30 | 82,10 |
F2 | 103,70 | 101,20 | 104,50 | 96,70 | 97,90 | 100,70 | 97,00 | 91,70 | 83,60 | 83,90 |
F3 | 116,10 | 117,60 | 117,70 | 115,60 | 107,70 | 111,30 | 106,10 | 104,50 | 95,20 | 99,00 |
HF | 134,20 | 134,20 | 129,00 | 128,50 | 126,80 | 122,60 | 122,20 | 117,30 | 101,20 | 108,00 |
31 | 32 | 33 | 34 | 35 | 36 | 37 | 38 | 39 | 40 | |
F1 | 76,10 | 81,70 | 70,80 | 66,70 | 72,10 | 66,40 | 49,60 | 52,80 | 50,50 | 52,80 |
F2 | 91,20 | 86,00 | 69,10 | 75,60 | 68,60 | 73,60 | 62,40 | 58,60 | 56,60 | 59,20 |
F3 | 93,00 | 91,70 | 79,70 | 81,60 | 79,40 | 79,10 | 67,10 | 69,50 | 68,40 | 68,50 |
Nhóm Tuần/Năng suất sữa
HF 104,80 108,40 89,00 94,10 94,20 89,90 73,30 81,00 74,50 72,00
F 1
F 2
F 3
H F
2 0 0
1 8 0
1 6 0
1 4 0
1 2 0
1 0 0
8 0
6 0
4 0
1 4 7 1 0 1 3 1 6 1 9 2 2 2 5 2 8 3 1 3 4 3 7 4 0
T u ầ n
N ă n g s u ấ t s ữ a (k g )
Hình 1. Năng suất sữa theo tuần (số liệu theo dõi)
Nhóm bò
Bảng 4. Năng suất sữa theo tuần (số liệu nuôi thí nghiệm)
Tuần/Năng suất sữa 1 2 3 4 5 6 7 8 9 10
F1 123,80 120,30 124,20 132,50 133,30 133,90 135,10 144,00 134,40 126,70
F2 129,30 129,60 133,60 138,90 151,90 144,80 142,40 137,70 138,90 136,80
F3 143,40 144,00 148,10 149,90 150,30 151,40 154,30 156,30 141,90 154,00
HF 144,30 152,00 145,20 155,00 152,80 155,10 157,30 167,30 149,00 157,00
11 12 13 14 15 16 14 18 19 20
F1 132,50 133,30 128,10 122,40 120,80 129,60 114,40 114,90 107,90 112,20
F2 133,00 138,50 129,10 125,30 126,70 124,60 117,00 115,90 116,00 114,90
F3 141,10 154,00 139,20 139,70 132,30 133,30 125,30 124,90 122,90 124,70
HF 149,40 156,90 141,10 143,30 146,60 139,00 126,80 129,10 126,50 128,80
21 22 23 24 25 26 27 28 29 30
F1 97,60 98,80 101,50 96,20 96,50 97,20 90,30 87,80 84,40 84,30
F2 106,20 101,90 105,90 102,60 95,50 97,40 94,20 99,60 86,50 89,30
F3 110,20 116,60 107,60 114,00 110,30 111,30 104,80 106,10 93,90 93,80
HF 117,60 115,60 115,60 120,20 107,20 116,60 110,30 113,70 97,10 100,10
31 32 33 34 35 36 37 38 39 40
F1 80,40 81,60 76,50 74,50 71,70 69,10 56,50 58,20 55,40 55,50
F2 83,20 89,00 73,10 77,00 79,70 74,90 62,60 60,40 58,40 59,10
F3 93,80 93,90 82,00 79,10 78,31 76,60 69,10 66,20 63,70 61,90
HF 96,50 101,80 84,60 84,50 78,90 82,10 70,00 70,20 69,70 66,40
F 1
F 2
F 3
H F
1 8 0
1 6 0
1 4 0
1 2 0
1 0 0
8 0
6 0
4 0
1 4 7 1 0 1 3 1 6 1 9 2 2 2 5 2 8 3 1 3 4 3 7 4 0
T u ầ n
N ă n g s u ấ t s ữ a ( k g )
Hình 2. Năng suất sữa theo tuần (số liệu nuôi thí nghiệm)