,304 | 1,170 | 94,661 | |||||||
17 | ,262 | 1,007 | 95,669 | ||||||
18 | ,237 | ,913 | 96,582 | ||||||
19 | ,213 | ,819 | 97,400 | ||||||
20 | ,187 | ,719 | 98,120 | ||||||
21 | ,177 | ,681 | 98,801 | ||||||
22 | ,132 | ,508 | 99,309 | ||||||
23 | ,100 | ,384 | 99,693 | ||||||
24 | ,053 | ,204 | 99,897 | ||||||
25 | ,016 | ,063 | 99,961 | ||||||
26 | ,010 | ,039 | 100,000 | ||||||
Extraction Method: Principal Component Analysis, | |||||||||
Có thể bạn quan tâm!
-

 Đối Với Hiệu Quả Của Việc Thanh Toán Viện Phí
 -
 Đánh giá sự hài lòng của khách hàng về chất lượng khám chữa bệnh của Bệnh viện Đa khoa Bà Rịa - 11
 -
 Đánh giá sự hài lòng của khách hàng về chất lượng khám chữa bệnh của Bệnh viện Đa khoa Bà Rịa - 12
 -
 Đánh giá sự hài lòng của khách hàng về chất lượng khám chữa bệnh của Bệnh viện Đa khoa Bà Rịa - 14
Xem toàn bộ 113 trang tài liệu này.
Component | ||||||
1 | 2 | 3 | 4 | 5 | 6 | |
PHDV2 | ,869 | |||||
PHDV5 | ,855 | |||||
PHDV3 | ,823 | |||||
PHDV4 | ,742 | |||||
PHDV1 | ,696 | |||||
PHDV6 | ,603 | |||||
TTLL2 | ,865 | |||||
TTLL3 | ,804 | |||||
TTLL1 | ,796 | |||||
TTLL4 | ,756 | |||||
TTLL5 | ,721 | |||||
TTLL6 | ,714 | |||||
TTCD1 | ,923 | |||||
TTCD2 | ,913 | |||||
,904 | ||||||
TTCD4 | ,851 | |||||
HQLT4 | ,811 | |||||
HQLT3 | ,802 | |||||
HQLT2 | ,748 | |||||
HQLT1 | ,712 | |||||
TGCK2 | ,868 | |||||
TGCK3 | ,843 | |||||
TGCK1 | ,797 | |||||
HQTT3 | ,716 | |||||
HQTT1 | ,697 | |||||
HQTT2 | ,582 | |||||
Extraction Method: Principal Component Analysis, Rotation Method: Varimax with Kaiser Normalization,a | ||||||
a, Rotation converged in 6 iterations, | ||||||
Kaiser-Meyer-Olkin Measure of Sampling Adequacy, | ,730 | |
Bartlett's Test of Sphericity | Approx, Chi-Square | 208,484 |
df | 6 | |
Sig, | ,000 | |
Component | Initial Eigenvalues | Extraction Sums of Squared Loadings | ||||
Total | % of Variance | Cumulative % | Total | % of Variance | Cumulative % | |
1 | 2,140 | 53,503 | 53,503 | 2,140 | 53,503 | 53,503 |
2 | ,757 | 18,914 | 72,417 | |||
,622 | 15,560 | 87,977 | ||||
4 | ,481 | 12,023 | 100,000 | |||
Extraction Method: Principal Component Analysis, | ||||||
Component | |
1 | |
Hailong3 | ,783 |
Hailong1 | ,776 |
Hailong2 | ,733 |
Hailong4 | ,623 |
Extraction Method: Principal Component Analysis, | |
a, 1 components extracted, | |
PHỤ LỤC 7
Phân tích hồi quy tuyến tính
Model | R | R Square | Adjusted R Square | Std, Error of the Estimate | Change Statistics | Durbin- Watson | ||||
R Square Change | F Change | df1 | df2 | Sig, F Change | ||||||
1 | ,808a | ,653 | ,645 | ,29861 | ,653 | 88,953 | 6 | 284 | ,000 | 1,106 |
a, Predictors: (Constant), HQLT, TTCD, TGCK, TTLL, PHDV, HQTT | ||||||||||
b, Dependent Variable: MDHL | ||||||||||
Model | Sum of Squares | df | Mean Square | F | Sig, | |
1 | Regression | 47,590 | 6 | 7,932 | 88,953 | ,000b |
Residual | 25,323 | 284 | ,089 | |||
Total | 72,913 | 290 | ||||
a, Dependent Variable: HAILONG | ||||||
b, Predictors: (Constant), HQLT, TTCD, TGCK, TTLL, PHDV, HQTT | ||||||
Model | Unstandardized Coefficients | Standardized Coefficients | t | Sig, | Correlations | Collinearity Statistics | |||||
B | Std, Error | Beta | Zero- order | Parti al | Part | Tolerance | VIF | ||||
1 | (Constant) | -,070 | ,181 | -,390 | ,697 | ||||||
TTCD | ,123 | ,028 | ,162 | 4,352 | ,000 | ,399 | ,250 | ,152 | ,881 | 1,135 | |
PHDV | ,317 | ,036 | ,379 | 8,853 | ,000 | ,678 | ,465 | ,310 | ,668 | 1,498 | |
HQTT | ,153 | ,039 | ,180 | 3,924 | ,000 | ,526 | ,227 | ,137 | ,581 | 1,721 | |
TTLL | ,213 | ,039 | ,225 | 5,494 | ,000 | ,563 | ,310 | ,192 | ,727 | 1,375 | |
TGCK | ,153 | ,031 | ,181 | 5,005 | ,000 | ,357 | ,285 | ,175 | ,932 | 1,073 | |
HQLT | ,086 | ,038 | ,100 | 2,263 | ,024 | ,452 | ,133 | ,079 | ,631 | 1,584 | |
a, Dependent Variable: HAILONG | |||||||||||
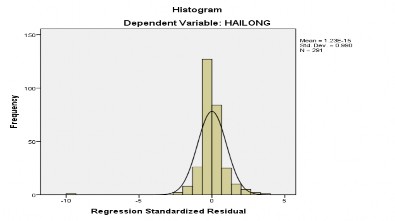
Normal P-P Plot of Regression Standardized Residual
Observed Cum Prob
Scatterplot Dependent Variable: HAILONG
0
HAILONG
e
8
200-
1.00-
![]()
-2 2
![]()
Regression Standardized Predicted Value
TTCD | PHDV | HQTT | TTLL | TGCK | HQLT | MDHL | ||
TTCD | Pearson Correlation | 1 | ||||||
PHDV | Pearson Correlation | ,332** | 1 | |||||
HQTT | Pearson Correlation | ,153** | ,393** | 1 | ||||
TTLL | Pearson Correlation | ,220** | ,467** | ,386** | 1 | |||
TGCK | Pearson Correlation | ,095 | ,207** | ,146* | ,155** | 1 | ||
HQLT | Pearson Correlation | ,164** | ,315** | ,588** | ,276** | ,208** | 1 | |
HAILONG | Pearson Correlation | ,399** | ,678** | ,526** | ,563** | ,357** | ,452** | 1 |
**, Correlation is significant at the 0,01 level (2-tailed), | ||||||||
*, Correlation is significant at the 0,05 level (2-tailed), | ||||||||
PHỤ LỤC 8
Phân biệt sự khác biệt theo đặc điểm cá nhân
GIOITINH | N | Mean | Std, Deviation | Std, Error Mean | |
MDHL | NAM | 133 | 3,7744 | ,47957 | ,04158 |
NU | 158 | 3,8165 | ,51984 | ,04136 |
Levene's Test for Equality of Variances | t-test for Equality of Means | ||||||||||
F | Sig, | t | df | Sig, (2- tailed) | Mean Differe nce | Std, Error Difference | 95% Confidence Interval of the Difference | ||||
Lower | Upper | ||||||||||
MDHL | Equal variances assumed | ,041 | ,839 | -,712 | 289 | ,477 | -,04202 | ,05906 | -,15825 | ,07422 | |
Equal variances not assumed | -,716 | 286,557 | ,474 | -,04202 | ,05865 | -,15745 | ,07342 | ||||
DOTUOI
DDHL | |||
Levene Statistic | df1 | df2 | Sig, |
4,735 | 3 | 287 | ,003 |