Component | |||||
1 | 2 | 3 | 4 | 5 | |
PE4 | .842 | ||||
PE2 | .831 | ||||
PE1 | .830 | ||||
PE3 | .804 | ||||
PE5 | .799 | ||||
PR2 | .918 | ||||
PR1 | .882 | ||||
PR3 | .862 | ||||
PR4 | .853 | ||||
PR5 | .706 | ||||
FC4 | .825 | ||||
FC2 | .813 | ||||
FC3 | .772 | ||||
FC1 | .627 | ||||
EE1 | .813 | ||||
EE2 | .774 | ||||
EE3 | .763 | ||||
EE4 | .651 | ||||
SI2 | .855 | ||||
SI1 | .822 | ||||
SI3 | .820 |
Có thể bạn quan tâm!
-

 Các yếu tố ảnh hưởng đến ý định sử dụng dịch vụ Ngân hàng điện tử của khách hàng tại TP.HCM - 12
 -
 Các yếu tố ảnh hưởng đến ý định sử dụng dịch vụ Ngân hàng điện tử của khách hàng tại TP.HCM - 13
 -
 Các yếu tố ảnh hưởng đến ý định sử dụng dịch vụ Ngân hàng điện tử của khách hàng tại TP.HCM - 14
 -
 Các yếu tố ảnh hưởng đến ý định sử dụng dịch vụ Ngân hàng điện tử của khách hàng tại TP.HCM - 16
 -
 Các yếu tố ảnh hưởng đến ý định sử dụng dịch vụ Ngân hàng điện tử của khách hàng tại TP.HCM - 17
Xem toàn bộ 139 trang tài liệu này.
Extraction Method: Principal Component Analysis. Rotation Method: Varimax with Kaiser Normalization.
a. Rotation converged in 5 iterations.
1 | 2 | 3 | 4 | 5 | |
1 | .643 | .198 | .418 | .478 | .379 |
2 | .146 | .910 | -.301 | -.164 | -.183 |
3 | -.704 | .363 | .561 | .191 | .145 |
4 | -.127 | .044 | -.327 | -.272 | .895 |
5 | .231 | .003 | .559 | -.796 | -.005 |
Extraction Method: Principal Component Analysis. Rotation Method: Varimax with Kaiser Normalization.
Phụ lục 6
KẾT QUẢ PHÂN TÍCH NHÂN TỐ KHÁM PHÁ EFA CHO BIẾN PHỤ THUỘC
Factor Analysis
Kaiser-Meyer-Olkin Measure of Sampling Adequacy. | .744 | |
Bartlett's Test of Sphericity | Approx. Chi-Square | 455.576 |
df | 3 | |
Sig. | .000 | |
Communalities
Initial | Extraction | |
UIE1 | 1.000 | .792 |
UIE2 | 1.000 | .834 |
UIE3 | 1.000 | .841 |
Extraction Method: Principal Component Analysis.
Total Variance Explained
Initial Eigenvalues | Extraction Sums of Squared Loadings | |||||
Total | % of Variance | Cumulative % | Total | % of Variance | Cumulative % | |
1 | 2.467 | 82.226 | 82.226 | 2.467 | 82.226 | 82.226 |
2 | .307 | 10.244 | 92.471 | |||
3 | .226 | 7.529 | 100.000 |
Extraction Method: Principal Component Analysis.
Component Matrixa
Component
1
.917 | |
UIE2 | .913 |
UIE1 | .890 |
Extraction Method: Principal Component Analysis. | |
a. 1 components extracted. | |
UIE3
Phân tích lần 1 Regression
Phụ lục 7
KẾT QUẢ PHÂN TÍCH HỒI QUY
Variables Entered/Removedb
Variables Entered | Variables Removed | Method | |
1 | SI, PR, FC, PE, EEa | . | Enter |
a. All requested variables entered.
b. Dependent Variable: UIE
Model Summaryb
R | R Square | Adjusted R Square | Std. Error of the Estimate | Durbin-Watson | |
1 | .828a | .686 | .680 | .46851 | 2.025 |
a. Predictors: (Constant), SI, PR, FC, PE, EE
b. Dependent Variable: UIE
ANOVAb
Sum of Squares | df | Mean Square | F | Sig. | ||
1 | Regression | 122.487 | 5 | 24.497 | 111.606 | .000a |
Residual | 55.972 | 255 | .219 | |||
Total | 178.460 | 260 |
a. Predictors: (Constant), SI, PR, FC, PE, EE
b. Dependent Variable: UIE
Coefficientsa
Unstandardized Coefficients | Standardized Coefficients | t | Sig. | Collinearity Statistics | ||||
B | Std. Error | Beta | Tolerance | VIF | ||||
1 | (Constant) | -.168 | .201 | -.836 | .404 | |||
PE | .242 | .048 | .221 | 5.085 | .000 | .652 | 1.535 | |
PR | -.051 | .035 | -.053 | -1.450 | .148 | .926 | 1.080 | |
EE | .491 | .048 | .465 | 10.144 | .000 | .585 | 1.709 | |
FC | .265 | .048 | .233 | 5.541 | .000 | .694 | 1.441 | |
SI | .125 | .038 | .133 | 3.279 | .001 | .744 | 1.344 |
a. Dependent Variable: UIE
Collinearity Diagnosticsa
Eigenvalue | Condition Index | Variance Proportions | |||||||
Model | Dimension | (Constant) | PE | PR | EE | FC | SI | ||
1 | 1 | 5.821 | 1.000 | .00 | .00 | .00 | .00 | .00 | .00 |
2 | .071 | 9.040 | .01 | .00 | .51 | .03 | .02 | .14 | |
3 | .038 | 12.388 | .00 | .12 | .07 | .13 | .04 | .80 | |
4 | .034 | 13.113 | .08 | .60 | .00 | .00 | .25 | .04 | |
5 | .021 | 16.627 | .04 | .28 | .09 | .84 | .21 | .01 | |
6 | .015 | 19.550 | .88 | .00 | .32 | .00 | .48 | .01 |
a. Dependent Variable: UIE
Residuals Statisticsa
Minimum | Maximum | Mean | Std. Deviation | N | |
Predicted Value | 1.0567 | 5.0244 | 3.4253 | .68637 | 261 |
Residual | -1.51544 | 1.91663 | .00000 | .46398 | 261 |
Std. Predicted Value | -3.451 | 2.330 | .000 | 1.000 | 261 |
Std. Residual | -3.235 | 4.091 | .000 | .990 | 261 |
a. Dependent Variable: UIE
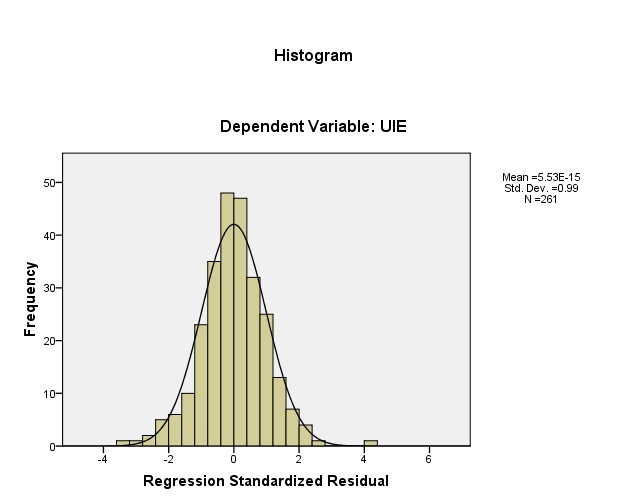
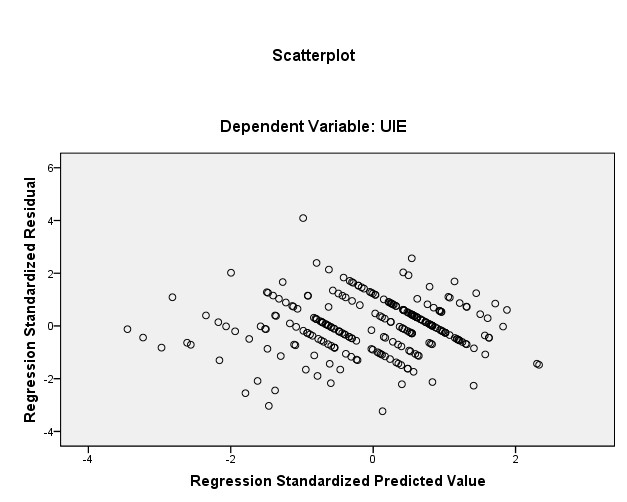
Charts
Phân tích lần 2
Regression
Variables Entered/Removedb
Variables Entered | Variables Removed | Method | |
1 | SI, PE, FC, EEa | . | Enter |
a. All requested variables entered.
b. Dependent Variable: UIE
Model Summaryb
R | R Square | Adjusted R Square | Std. Error of the Estimate | Durbin-Watson | |
1 | .827a | .684 | .679 | .46952 | 2.009 |