Variables Entered/Removedb
Variables Entered | Variables Removed | Method | |
1 | SI, PE, FC, EEa | . | Enter |
Có thể bạn quan tâm!
-

 Các yếu tố ảnh hưởng đến ý định sử dụng dịch vụ Ngân hàng điện tử của khách hàng tại TP.HCM - 13
 -
 Các yếu tố ảnh hưởng đến ý định sử dụng dịch vụ Ngân hàng điện tử của khách hàng tại TP.HCM - 14
 -
 Các yếu tố ảnh hưởng đến ý định sử dụng dịch vụ Ngân hàng điện tử của khách hàng tại TP.HCM - 15
 -
 Các yếu tố ảnh hưởng đến ý định sử dụng dịch vụ Ngân hàng điện tử của khách hàng tại TP.HCM - 17
Xem toàn bộ 139 trang tài liệu này.
a. Predictors: (Constant), SI, PE, FC, EE
b. Dependent Variable: UIE
ANOVAb
Sum of Squares | df | Mean Square | F | Sig. | ||
1 | Regression | 122.026 | 4 | 30.506 | 138.386 | .000a |
Residual | 56.434 | 256 | .220 | |||
Total | 178.460 | 260 |
a. Predictors: (Constant), SI, PE, FC, EE
b. Dependent Variable: UIE
Coefficientsa
Unstandardized Coefficients | Standardized Coefficients | t | Sig. | Collinearity Statistics | ||||
B | Std. Error | Beta | Tolerance | VIF | ||||
1 | (Constant) | -.327 | .169 | -1.930 | .055 | |||
PE | .224 | .046 | .205 | 4.866 | .000 | .699 | 1.431 | |
EE | .494 | .049 | .467 | 10.180 | .000 | .586 | 1.707 | |
FC | .271 | .048 | .239 | 5.682 | .000 | .700 | 1.429 | |
SI | .128 | .038 | .136 | 3.353 | .001 | .746 | 1.340 |
a. Dependent Variable: UIE
Eigenvalue | Condition Index | Variance Proportions | ||||||
Model | Dimension | (Constant) | PE | EE | FC | SI | ||
1 | 1 | 4.882 | 1.000 | .00 | .00 | .00 | .00 | .00 |
2 | .041 | 10.929 | .03 | .11 | .03 | .01 | .97 | |
3 | .034 | 12.005 | .12 | .66 | .00 | .23 | .03 | |
4 | .025 | 13.987 | .41 | .09 | .69 | .01 | .00 | |
5 | .018 | 16.289 | .44 | .13 | .27 | .74 | .00 | |
a. Dependent Variable: UIE | ||||||||
Residuals Statisticsa
Minimum | Maximum | Mean | Std. Deviation | N | |
Predicted Value | 1.1044 | 4.9001 | 3.4253 | .68508 | 261 |
Residual | -1.54214 | 1.97618 | .00000 | .46589 | 261 |
Std. Predicted Value | -3.388 | 2.153 | .000 | 1.000 | 261 |
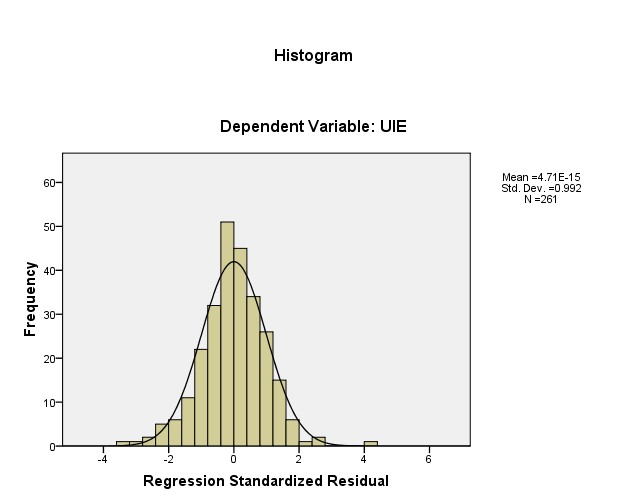
Std. Residual | -3.285 | 4.209 | .000 | .992 | 261 |
a. Dependent Variable: UIE
Charts
Scatterplot
Dependent Variable: UIE
6-
O
O OQ
O O
![]()
Reg tess1•rr Stand and1zed Res1d uat
-2 0 2
Regression Standardized Predicted Value
Phụ lục 8
KẾT QUẢ KIỂM ĐỊNH CÁC THANG ĐO BẰNG CRONBACH’S ALPHA
Reliability
Scale: ALL VARIABLES
Case Processing Summary
N | % | ||
Cases | Valid | 261 | 100.0 |
Excludeda | 0 | .0 | |
Total | 261 | 100.0 |
a. Listwise deletion based on all variables in the procedure.
Reliability Statistics
N of Items | |
.918 | 5 |
Item-Total Statistics
Scale Mean if Item Deleted | Scale Variance if Item Deleted | Corrected Item-Total Correlation | Cronbach's Alpha if Item Deleted | |
PE1 | 12.29 | 9.229 | .779 | .902 |
PE2 | 12.32 | 9.504 | .809 | .896 |
PE3 | 12.34 | 9.119 | .785 | .900 |
PE4 | 12.31 | 9.244 | .825 | .892 |
PE5 | 12.27 | 9.499 | .751 | .907 |
Scale: ALL VARIABLES
Case Processing Summary
N | % | ||
Cases | Valid | 261 | 100.0 |
Excludeda | 0 | .0 | |
Total | 261 | 100.0 |
a. Listwise deletion based on all variables in the procedure.
Reliability Statistics
N of Items | |
.834 | 4 |
Item-Total Statistics
Scale Mean if Item Deleted | Scale Variance if Item Deleted | Corrected Item- Total Correlation | Cronbach's Alpha if Item Deleted | |
EE1 | 10.05 | 6.094 | .736 | .756 |
EE2 | 10.26 | 6.749 | .682 | .784 |
EE3 | 10.11 | 6.319 | .657 | .793 |
EE4 | 10.44 | 6.717 | .587 | .824 |
Scale: ALL VARIABLES
Case Processing Summary
N | % | ||
Cases | Valid | 261 | 100.0 |
Excludeda | 0 | .0 | |
Total | 261 | 100.0 |
a. Listwise deletion based on all variables in the procedure.
Reliability Statistics
N of Items | |
.829 | 5 |
Item-Total Statistics
Scale Mean if Item Deleted | Scale Variance if Item Deleted | Corrected Item- Total Correlation | Cronbach's Alpha if Item Deleted | |
FC1 | 14.57 | 8.677 | .559 | .813 |
FC2 | 14.48 | 7.997 | .710 | .773 |
FC3 | 14.34 | 8.024 | .657 | .786 |
FC4 | 14.16 | 7.505 | .665 | .785 |
FC5 | 14.27 | 8.497 | .552 | .816 |
Scale: ALL VARIABLES
Case Processing Summary
N | % | ||
Cases | Valid | 261 | 100.0 |
Excludeda | 0 | .0 | |
Total | 261 | 100.0 |
a. Listwise deletion based on all variables in the procedure.
Reliability Statistics
N of Items | |
.789 | 4 |
Item-Total Statistics
Scale Mean if Item Deleted | Scale Variance if Item Deleted | Corrected Item- Total Correlation | Cronbach's Alpha if Item Deleted | |
SI1 | 9.85 | 5.433 | .662 | .704 |
SI2 | 9.97 | 5.165 | .686 | .690 |
SI3 | 9.84 | 4.997 | .758 | .650 |
SI4 | 9.82 | 7.035 | .315 | .860 |
Scale: ALL VARIABLES
Case Processing Summary
N | % | ||
Cases | Valid | 261 | 100.0 |
Excludeda | 0 | .0 | |
Total | 261 | 100.0 |
a. Listwise deletion based on all variables in the procedure.
Reliability Statistics
N of Items | |
.906 | 5 |
Item-Total Statistics
Scale Mean if Item Deleted | Scale Variance if Item Deleted | Corrected Item- Total Correlation | Cronbach's Alpha if Item Deleted | |
PR1 | 13.52 | 11.758 | .805 | .876 |
PR2 | 13.45 | 11.164 | .857 | .864 |
PR3 | 13.54 | 11.488 | .767 | .884 |
PR4 | 13.54 | 11.811 | .780 | .881 |
PR5 | 13.62 | 13.191 | .613 | .914 |