Phụ lục 5: Dò tìm các vi phạm của mô hình
ander paj»!PaJd paz!p«eP°° is
00000’8
00000’ f
00000’0
00000’ f-
00000’8-
00000’8-
—00000”t'-
—00000’8
—00000‘0
O
OO
O
O
—00000’8
Phụ lục 5.1. Biểu đồ phân tán Scatterplot của giá trị dự đoán chuẩn hóa và giá trị phần dư chuẩn hóa
Phụ lục 5.2. Tương quan giữa trị tuyệt đối của phần dư và cán biến độc lập
Correlations
MTHT | PTHH | GV | NV | Trituyetdoi cuaphandu | |||
Spearman's rho | MTHT | Correlation Coefficient | 1.000 | .658** | .646** | .513** | .052 |
Sig. (2-tailed) | . | .000 | .000 | .000 | .415 | ||
N | 245 | 245 | 245 | 245 | 245 | ||
PTHH | Correlation Coefficient | .658** | 1.000 | .604** | .488** | -.006 | |
Sig. (2-tailed) | .000 | . | .000 | .000 | .924 | ||
N | 245 | 245 | 245 | 245 | 245 | ||
GV | Correlation Coefficient | .646** | .604** | 1.000 | .481** | .005 | |
Sig. (2-tailed) | .000 | .000 | . | .000 | .942 | ||
N | 245 | 245 | 245 | 245 | 245 | ||
NV | Correlation Coefficient | .513** | .488** | .481** | 1.000 | -.123 | |
Sig. (2-tailed) | .000 | .000 | .000 | . | .054 | ||
N | 245 | 245 | 245 | 245 | 245 | ||
Trituyetdoi cuaphandu | Correlation Coefficient | .052 | -.006 | .005 | -.123 | 1.000 | |
Sig. (2-tailed) | .415 | .924 | .942 | .054 | . | ||
N | 245 | 245 | 245 | 245 | 245 |
Có thể bạn quan tâm!
-

 Các Biến Đo Lường Chất Lượng Dịch Vụ Đào Tạo Của Học Viên Lần 1
 -
 Ma Trận Hệ Số Tương Quan Của Các Biến Quan Sát Đưa Vào Efa Của Thang Đo Chất Lượng Dịch Vụ Đào Tạo (*)
 -
 Các nhân tố của chất lượng dịch vụ đào tạo ảnh hưởng đến sự hài lòng của học viên tại các trường trung cấp chuyên nghiệp - Địa bàn tỉnh Đồng Nai - 13
Xem toàn bộ 112 trang tài liệu này.
**. Correlation is significant at the 0.01 level (2-tailed).
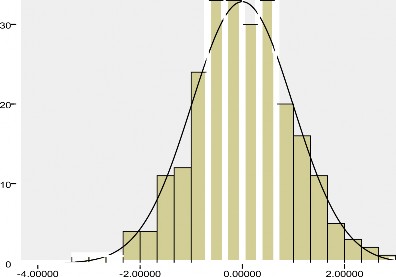
Phụ lục 5.3. Biểu đồ Histogram và đồ thị Q – Q Pilot của phần dư chuẩn hóa
![]()
Frequency
0- | |||||
4
Standardized Residual
-1
0
1
Normal Q-Q Plot of Standard inch Resid ual
Expected Normal Value
1-
-1-
0
Observed Value
Phụ lục 6.
N | Mean | Std. Deviation | Std. Error Mean | |
SAS | 245 | 3.0490 | .80547 | .05146 |
Phụ lục 6.1. Kiểm định giá trị trung bình của tổng thể One-Sample Statistics
One-Sample Test
Test Value = 3.05 | ||||||
T | df | Sig. (2-tailed) | Mean Difference | 95% Confidence Interval of the Difference | ||
Lower | Upper | |||||
SAS | -.020 | 244 | .984 | -.00102 | -.1024 | .1003 |
Kiểm định tham số (T test)
Group Statistics
N | Mean | Std. Deviation | Std. Error Mean | ||
SAS | Nam | 138 | 2.9928 | .80998 | .06895 |
Nu | 107 | 3.1215 | .79752 | .07710 |
Independent Samples Test
Levene's Test for Equality of Variances | t-test for Equality of Means | |||||||||
F | Sig. | t | Df | Sig. (2-tailed) | Mean Difference | Std. Error Difference | 95% Confidence Interval of the Difference | |||
Lower | Upper | |||||||||
SAS | Equal variances assumed | .241 | .624 | -1.242 | 243 | .215 | -.12874 | .10364 | -.33288 | .07540 |
Equal variances not assumed | -1.245 | 229.683 | .215 | -.12874 | .10343 | -.33254 | .07506 | |||
Kiểm định phi tham số (Main Whitney)
Ranks
N | Mean Rank | Sum of Ranks | ||
SAS | Nam | 138 | 117.23 | 16177.50 |
Nu | 107 | 130.44 | 13957.50 | |
Total | 245 |
Test Statisticsa
SAS | |
Mann-Whitney U | 6586.500 |
Wilcoxon W | 16177.500 |
Z | -1.460 |
Asymp. Sig. (2-tailed) | .144 |
a. Grouping Variable: sex
N | Mean | Std. Deviation | Std. Error Mean | |
SAS 1 | 135 | 3.1062 | .77871 | .06702 |
dimension12 | 110 | 2.9788 | .83535 | .07965 |
Independent Samples Test
Levene's Test for Equality of Variances | t-test for Equality of Means | |||||||||
F | Sig. | t | df | Sig. (2-tailed) | Mean Difference | Std. Error Difference | 95% Confidence Interval of the Difference | |||
Lower | Upper | |||||||||
SAS | Equal variances assumed | 1.062 | .304 | 1.233 | 243 | .219 | .12738 | .10335 | -.07619 | .33096 |
Equal variances not assumed | 1.224 | 225.885 | .222 | .12738 | .10409 | -.07773 | .33250 | |||
Kiểm định phi tham số :Ranks
N | Mean Rank | Sum of Ranks | ||
1 | 135 | 128.65 | 17367.50 | |
dimension1 | 2 | 110 | 116.07 | 12767.50 |
Total | 245 |
SAS
Test Statisticsa
SAS | |
Mann-Whitney U | 6662.500 |
Wilcoxon W | 12767.500 |
Z | -1.394 |
Asymp. Sig. (2-tailed) | .163 |
a. Grouping Variable: gdhoc
N | Mean | Std. Deviation | Std. Error Mean | ||
SAS | Ngoai cong lap | 66 | 2.7879 | 1.01381 | .12479 |
Cong lap | 179 | 3.1453 | .69239 | .05175 |
Loaihinhtrg
Independent Samples Test
Levene's Test for Equality of Variances | t-test for Equality of Means | |||||||||
F | Sig. | t | df | Sig. (2-tailed) | Mean Difference | Std. Error Difference | 95% Confidence Interval of the Difference | |||
Lower | Upper | |||||||||
SAS | Equal variances assumed | 31.376 | .000 | -3.136 | 243 | .002 | -.35737 | .11395 | -.58182 | -.13292 |
Equal variances not assumed | -2.645 | 88.326 | .010 | -.35737 | .13510 | -.62584 | -.08891 | |||
Loaihinhtrg | N | Mean Rank | Sum of Ranks | |
SAS | Ngoai cong lap | 66 | 106.75 | 7045.50 |
Cong lap | 179 | 128.99 | 23089.50 | |
Total | 245 | |||
Kiểm định phi tham số (Main Whitney) Ranks
Test Statisticsa
SAS | |
Mann-Whitney U | 4834.500 |
Wilcoxon W | 7045.500 |
Z | -2.198 |
Asymp. Sig. (2-tailed) | .028 |
a. Grouping Variable: loaihinhtrg
104
Phụ lục 6.5. Kiểm định Sự hài lòng của học viên theo trường đang học.
Descriptives
SAS
N | Mean | Std. Deviation | Std. Error | 95% Confidence Interval for Mean | Minimum | Maximum | ||
Lower Bound | Upper Bound | |||||||
TCCN Kinh te | 61 | 3.2404 | .66425 | .08505 | 3.0703 | 3.4106 | 1.67 | 4.33 |
TCCN Tin hoc Buu chinh Vien thong | 66 | 2.7121 | .95879 | .11802 | 2.4764 | 2.9478 | 1.00 | 4.33 |
TCCN Ky thuat Cong nghiep Dong Nai | 64 | 3.0260 | .57675 | .07209 | 2.8820 | 3.1701 | 2.00 | 4.00 |
TCCN Ky thuat Cong nghiep Nhon Trach | 54 | 3.2716 | .85432 | .11626 | 3.0384 | 3.5048 | 2.00 | 4.33 |
Total | 245 | 3.0490 | .80547 | .05146 | 2.9476 | 3.1503 | 1.00 | 4.33 |
Test of Homogeneity of Variances
SAS
df1 | df2 | Sig. | |
12.620 | 3 | 241 | .000 |
Post Hoc Tests
Multiple Comparisons SAS
Tamhane
(J) truong | Mean Difference (I-J) | Std. Error | Sig. | 95% Confidence Interval | ||
Lower Bound | Upper Bound | |||||
TCCN Kinh te | TCCN Tin hoc Buu chinh Vien thong | .52832* | .14547 | .003 | .1389 | .9177 |
TCCN Ky thuat Cong nghiep Dong Nai | .21440 | .11149 | .296 | -.0839 | .5127 | |
TCCN Ky thuat Cong nghiep Nhon Trach | -.03117 | .14405 | 1.000 | -.4178 | .3555 | |
TCCN Buu chinh Vien thong | TCCN Kinh te | -.52832* | .14547 | .003 | -.9177 | -.1389 |
TCCN Ky thuat Cong nghiep Dong Nai | -.31392 | .13830 | .142 | -.6846 | .0568 | |
TCCN Ky thuat Cong nghiep Nhon Trach | -.55948* | .16566 | .006 | -1.0028 | -.1161 | |
TCCN Ky thuat Cong nghiep Dong Nai | TCCN Kinh te | -.21440 | .11149 | .296 | -.5127 | .0839 |
TCCN Tin hoc Buu chinh Vien thong | .31392 | .13830 | .142 | -.0568 | .6846 | |
TCCN Ky thuat Cong nghiep Nhon Trach | -.24556 | .13680 | .378 | -.6135 | .1224 | |
TCCN Ky thuat Cong nghiep Nhon Trach | TCCN Kinh te | .03117 | .14405 | 1.000 | -.3555 | .4178 |
TCCN Tin hoc Buu chinh Vien thong | .55948* | .16566 | .006 | .1161 | 1.0028 | |
TCCN Ky thuat Cong nghiep Dong Nai | .24556 | .13680 | .378 | -.1224 | .6135 |
*. The mean difference is significant at the 0.05 level.