Trường ĐạihọcKinhtếHuế
Total Variance Explained
Initial | Eigenvalues | Extraction Sums of Squared Loadings | Rotation Sums of Squared Loadings | ||||||
Total | % of Variance | Cumulativ e % | Total | % of Variance | Cumulativ e % | Total | % of Variance | Cumul ative % | |
1 | 5.463 | 22.763 | 22.763 | 5.463 | 22.763 | 22.763 | 3.115 | 12.981 | 12.981 |
2 | 2.296 | 9.567 | 32.330 | 2.296 | 9.567 | 32.330 | 2.737 | 11.404 | 24.385 |
3 | 1.930 | 8.043 | 40.374 | 1.930 | 8.043 | 40.374 | 2.445 | 10.186 | 34.571 |
4 | 1.603 | 6.681 | 47.055 | 1.603 | 6.681 | 47.055 | 2.085 | 8.688 | 43.260 |
5 | 1.527 | 6.364 | 53.418 | 1.527 | 6.364 | 53.418 | 2.049 | 8.537 | 51.797 |
6 | 1.255 | 5.231 | 58.649 | 1.255 | 5.231 | 58.649 | 1.645 | 6.852 | 58.649 |
7 | .923 | 3.844 | 62.493 | ||||||
8 | .902 | 3.758 | 66.252 | ||||||
9 | .822 | 3.425 | 69.677 | ||||||
10 | .759 | 3.164 | 72.841 | ||||||
11 | .714 | 2.977 | 75.818 | ||||||
12 | .671 | 2.794 | 78.612 | ||||||
13 | .618 | 2.575 | 81.187 | ||||||
14 | .586 | 2.440 | 83.627 | ||||||
15 | .556 | 2.318 | 85.945 | ||||||
16 | .514 | 2.141 | 88.086 | ||||||
17 | .507 | 2.112 | 90.198 | ||||||
18 | .467 | 1.944 | 92.142 | ||||||
19 | .403 | 1.680 | 93.822 | ||||||
20 | .360 | 1.500 | 95.322 | ||||||
21 | .325 | 1.354 | 96.676 | ||||||
22 | .312 | 1.300 | 97.976 | ||||||
23 | .285 | 1.187 | 99.163 | ||||||
24 | .201 | .837 | 100.000 |
Có thể bạn quan tâm!
-

 Đối Với Ngân Hàng Nông Nghiệp Và Phát Triển Nông Thôn Việt Nam
 -
 Đối Với Ngân Hàng Nông Nghiệp Và Phát Triển Nông Thôn Việt Nam - Chi Nhánh Thừa Thiên Huế
 -
 Đánh Giá Thang Đo Bằng Hệ Số Tin Cậy Cronbach’S Alpha
 -
 Các nhân tố ảnh hưởng đến mức độ hài lòng của khách hàng về chất lượng dịch vụ tín dụng cá nhân tại Ngân hàng Nông nghiệp và Phát triển nông thôn Việt Nam - Chi nhánh Thừa Thiên Huế - 15
Xem toàn bộ 123 trang tài liệu này.
Extraction Method: Principal Component Analysis.
Trường ĐạihọcKinhtếHuế
Rotated Component Matrixa
Component | ||||||
1 | 2 | 3 | 4 | 5 | 6 | |
TC3 | .796 | |||||
TC4 | .752 | |||||
TC5 | .727 | |||||
TC2 | .688 | |||||
TC1 | .620 | |||||
DU1 | .833 | |||||
DU2 | .791 | |||||
DU4 | .779 | |||||
DU3 | .754 | |||||
DC5 | .780 | |||||
DC4 | .728 | |||||
DC2 | .716 | |||||
DC1 | .553 | |||||
DC3 | .502 | |||||
PTHH4 | .749 | |||||
PTHH1 | .743 | |||||
PTHH3 | .626 | |||||
PTHH2 | .621 | |||||
GC3 | .786 | |||||
GC2 | .771 | |||||
GC1 | .735 | |||||
DB3 | .738 | |||||
DB1 | .721 | |||||
DB4 | .696 |
Extraction Method: Principal Component Analysis. Rotation Method: Varimax with Kaiser Normalization.a
b. Nhân tố mức độ hài lòng
KMO and Bartlett's Test
.670 | |
Bartlett's Test of Sphericity Approx. Chi-Square | 125.586 |
df | 3 |
Sig. | .000 |
Trường ĐạihọcKinhtếHuế
Total Variance Explained
Initial | Eigenvalues | Extraction Sums of Squared Loadings | ||||
Total | % of Variance | Cumulative % | Total | % of Variance | Cumulati ve % | |
1 | 2.003 | 66.782 | 66.782 | 2.003 | 66.782 | 66.782 |
2 | .597 | 19.885 | 86.667 | |||
3 | .400 | 13.333 | 100.000 |
Extraction Method: Principal Component Analysis.
Component Matrixa
Component | |
1 | |
HL1 HL3 HL2 | .853 .836 .760 |
Extraction Method: Principal Component Analysis.
Trường ĐạihọcKinhtếHuế
5. PHÂN TÍCH TƯƠNG QUAN
Correlations
HH | TC | DU | DC | GC | dbbbbb | HL | ||
HH | Pearson Correlation | 1 | .391** | .127 | .265** | .259** | .107 | .367** |
Sig. (2-tailed) | .000 | .005 | .000 | .001 | .003 | .000 | ||
N | 173 | 173 | 173 | 173 | 173 | 173 | 173 | |
TC | Pearson Correlation | .391** | 1 | .237** | .313** | .461** | .123 | .577** |
Sig. (2-tailed) | .000 | .002 | .000 | .000 | .008 | .000 | ||
N | 173 | 173 | 173 | 173 | 173 | 173 | 173 | |
DU | Pearson Correlation | .127 | .237** | 1 | .205** | .309** | .081 | .411** |
Sig. (2-tailed) | .095 | .002 | .007 | .000 | .009 | .000 | ||
N | 173 | 173 | 173 | 173 | 173 | 173 | 173 | |
DC | Pearson Correlation | .265** | .313** | .205** | 1 | .300** | .109 | .468** |
Sig. (2-tailed) | .000 | .000 | .007 | .000 | .002 | .000 | ||
N | 173 | 173 | 173 | 173 | 173 | 173 | 173 | |
GC | Pearson Correlation | .259** | .461** | .309** | .300** | 1 | .173* | .535** |
Sig. (2-tailed) | .001 | .000 | .000 | .000 | .023 | .000 | ||
N | 173 | 173 | 173 | 173 | 173 | 173 | 173 | |
dbbbbb | Pearson Correlation | .107 | .123 | .081 | .109 | .173* | 1 | .260** |
Sig. (2-tailed) | .163 | .108 | .289 | .152 | .023 | .001 | ||
N | 173 | 173 | 173 | 173 | 173 | 173 | 173 | |
HL | Pearson Correlation | .367** | .577** | .411** | .468** | .535** | .260** | 1 |
Sig. (2-tailed) | .000 | .000 | .000 | .000 | .000 | .001 | ||
N | 173 | 173 | 173 | 173 | 173 | 173 | 173 |
**. Correlation is significant at the 0.01 level (2-tailed).
*. Correlation is significant at the 0.05 level (2-tailed).
Trường ĐạihọcKinhtếHuế
6. HỒI QUY
* Mô hình ban đầu
Variables Entered/Removeda
Variables Entered | Variables Removed | Method | |
1 | DBNEW, DU, HH, DC, GC, TCb | . | Enter |
a. Dependent Variable: HL
b. All requested variables entered.
Model Summaryb
R | R Square | Adjusted R Square | Std. Error of the Estimate | Durbin-Watson | |
1 | .742a | .550 | .534 | .490341164780 876 | 1.748 |
a. Predictors: (Constant), DBNEW, DU, HH, DC, GC, TC
b. Dependent Variable: HL
ANOVAa
Sum of Squares | df | Mean Square | F | Sig. | ||
1 | Regression | 48.875 | 6 | 8.146 | 33.880 | .000b |
Residual | 39.912 | 166 | .240 | |||
Total | 88.787 | 172 |
a. Dependent Variable: HL
b. Predictors: (Constant), DBNEW, DU, HH, DC, GC, TC
Coefficientsa
Unstandardized Coefficients | Standardized Coefficients | t | Sig. | Collinearity Statistics | ||||
B | Std. Error | Beta | Tolerance | VIF | ||||
1 | (Constant) | -.749 | .346 | -2.164 | .032 | |||
HH | .095 | .060 | .091 | 1.585 | .115 | .819 | 1.22 1 | |
TC | .303 | .062 | .307 | 4.882 | .000 | .686 | 1.45 7 | |
DU | .180 | .049 | .203 | 3.658 | .000 | .883 | 1.13 2 | |
DC | .262 | .066 | .227 | 4.002 | .000 | .842 | 1.18 8 |
Trường ĐạihọcKinhtếHuế
GC | .191 | .055 | .216 | 3.509 | .001 | .715 | 1.39 9 |
DBNEW | .132 | .052 | .134 | 2.533 | .012 | .963 | 1.03 9 |
a. Dependent Variable: HL
*Sau khi loại bỏ biến phương tiện hữu hình
Variables Entered/Removeda
Variables Entered | Variables Removed | Method | |
1 | dbbbbb, DU, DC, TC, GCb | . | Enter |
a. Dependent Variable: HL
b. All requested variables entered.
Model Summaryb
R | R Square | Adjusted R Square | Std. Error of the Estimate | Durbin-Watson | |
1 | .737a | .544 | .530 | .492554941782 688 | 1.749 |
a. Predictors: (Constant), dbbbbb, DU, DC, TC, GC
b. Dependent Variable: HL
Coefficientsa
Unstandardized Coefficients | Standardized Coefficients | t | Sig. | Collinearity | Statistics | |||
B | Std. Error | Beta | Tolerance | VIF | ||||
1 | (Constant ) | -.593 | .333 | -1.779 | .077 | |||
TC | .331 | .060 | .335 | 5.540 | .000 | .747 | 1.338 | |
DU | .180 | .049 | .203 | 3.642 | .000 | .883 | 1.132 | |
DC | .277 | .065 | .240 | 4.257 | .000 | .860 | 1.163 | |
GC | .197 | .055 | .222 | 3.597 | .000 | .717 | 1.394 | |
dbbbbb | .136 | .052 | .138 | 2.595 | .010 | .965 | 1.036 |
a. Dependent Variable: HL
Trường ĐạihọcKinhtếHuế
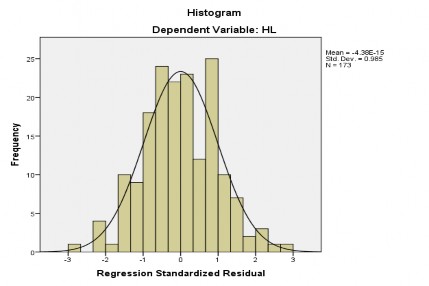
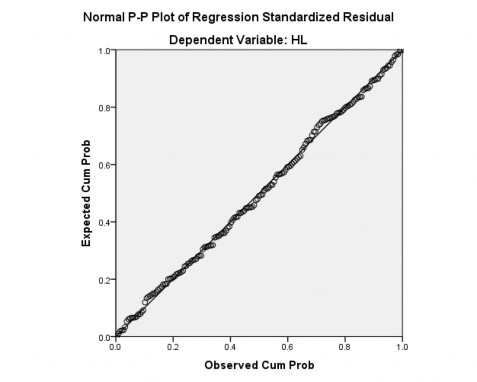
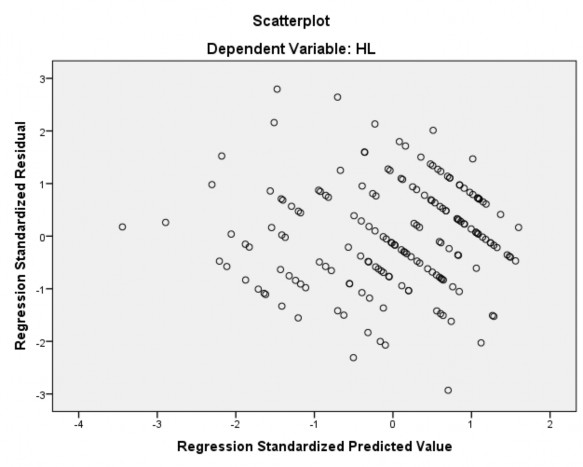
7. KIỂM ĐỊNH PHẦN DƯ
Trường ĐạihọcKinhtếHuế
8. KIỂM ĐỊNH ONE SAMPLE T TEST
1. Đảm bảo
One-Sample Statistics
N | Mean | Std. Deviation | Std. Error Mean | |
DB11 | 173 | 3.87 | .986 | .075 |
DB21 | 173 | 3.76 | .946 | .072 |
DB31 | 173 | 3.88 | .978 | .074 |
DB41 | 173 | 3.74 | 1.044 | .079 |
One-Sample Test
Test | Value | = | 4 | |||
t | df | Sig. (2-tailed) | Mean Difference | 95% Confidence Interval of the Difference | ||
Lower | Upper | |||||
DB11 | -1.696 | 172 | .092 | -.127 | -.28 | .02 |
DB21 | -3.377 | 172 | .001 | -.243 | -.38 | -.10 |
DB31 | -1.633 | 172 | .104 | -.121 | -.27 | .03 |
DB41 | -3.279 | 172 | .001 | -.260 | -.42 | -.10 |