Cronbach's Alpha | N of Items |
0.715 | 4 |
Có thể bạn quan tâm!
-

 Theo Quý Chuyên Gia, Nhân Tố Nào Dưới Đây Ảnh Hưởng Đến Lập Dự Toán Ngân Sách Tại Các Đơn Vị Cục Dự Trữ Nhà Nước Khu Vực Đông Nam Bộ
 -
 Các nhân tố ảnh hưởng đến lập dự toán ngân sách tại các đơn vị Cục Dự trữ Nhà nước khu vực Đông Nam Bộ - 12
 -
 Các nhân tố ảnh hưởng đến lập dự toán ngân sách tại các đơn vị Cục Dự trữ Nhà nước khu vực Đông Nam Bộ - 13
Xem toàn bộ 113 trang tài liệu này.
Scale: DUTOAN Reliability Statistics
Item-Total Statistics
Scale Mean if Item Deleted | Scale Variance if Item Deleted | Corrected Item-Total Correlation | Cronbach's Alpha if Item Deleted | |
DUTOAN1 | 13.335 | 1.362 | 0.501 | 0.653 |
DUTOAN2 | 13.317 | 1.343 | 0.494 | 0.657 |
DUTOAN3 | 13.354 | 1.330 | 0.516 | 0.643 |
DUTOAN4 | 13.304 | 1.363 | 0.494 | 0.657 |
KMO and Bartlett's Test
0.698 | ||
Bartlett's Test of Sphericity | Approx. Chi-Square | 1373.551 |
df | 231 | |
Sig. | 0.000 |
Total Variance Explained
Initial Eigenvalues | Extraction Sums of Squared Loadings | Rotation Sums of Squared Loadings | |||||||
Total | % of Varian ce | Cumulat ive % | Tot al | % of Varian ce | Cumulat ive % | Tot al | % of Varian ce | Cumulat ive % | |
1 | 3.714 | 16.881 | 16.881 | 3.714 | 16.881 | 16.881 | 2.965 | 13.476 | 13.476 |
2 | 3.229 | 14.679 | 31.559 | 3.229 | 14.679 | 31.559 | 2.913 | 13.239 | 26.715 |
3 | 2.739 | 12.448 | 44.007 | 2.739 | 12.448 | 44.007 | 2.825 | 12.841 | 39.556 |
4 | 2.043 | 9.289 | 53.296 | 2.043 | 9.289 | 53.296 | 2.407 | 10.943 | 50.499 |
5 | 1.712 | 7.783 | 61.079 | 1.712 | 7.783 | 61.079 | 2.195 | 9.978 | 60.477 |
6 | 1.073 | 4.875 | 65.954 | 1.073 | 4.875 | 65.954 | 1.205 | 5.477 | 65.954 |
7 | 0.875 | 3.979 | 69.933 | ||||||
8 | 0.804 | 3.657 | 73.590 | ||||||
9 | 0.702 | 3.190 | 76.780 | ||||||
10 | 0.657 | 2.988 | 79.768 | ||||||
11 | 0.600 | 2.728 | 82.496 | ||||||
12 | 0.553 | 2.515 | 85.011 | ||||||
13 | 0.514 | 2.338 | 87.349 | ||||||
14 | 0.452 | 2.056 | 89.405 | ||||||
15 | 0.418 | 1.899 | 91.304 | ||||||
16 | 0.373 | 1.694 | 92.997 | ||||||
17 | 0.348 | 1.583 | 94.580 | ||||||
18 | 0.301 | 1.370 | 95.950 | ||||||
19 | 0.276 | 1.255 | 97.205 | ||||||
20 | 0.238 | 1.081 | 98.286 | ||||||
21 | 0.195 | 0.887 | 99.173 | ||||||
22 | 0.182 | 0.827 | 100.000 |
Extraction Method: Principal Component Analysis.
Rotated Component Matrixa
Component | |||||
1 | 2 | 3 | 4 | 5 | |
QUYMO3 | 0.866 | ||||
QUYMO4 | 0.845 | ||||
QUYMO2 | 0.837 | ||||
QUYMO1 | 0.785 | ||||
PCLD3 | 0.816 | ||||
PCLD2 | 0.793 | ||||
PCLD4 | 0.756 | ||||
PCLD1 | 0.705 | ||||
PCLD5 | 0.673 | ||||
QUYTRINH4 | 0.852 | ||||
QUYTRINH3 | 0.851 | ||||
QUYTRINH2 | 0.796 | ||||
QUYTRINH1 | 0.787 | ||||
UNGDUNG3 | 0.872 | ||||
UNGDUNG4 | 0.722 | ||||
UNGDUNG1 | 0.702 | ||||
UNGDUNG2 | 0.634 | ||||
UNGDUNG5 | 0.633 | ||||
MDTG2 | 0.782 | ||||
MDTG3 | 0.728 | ||||
MDTG1 | 0.712 | ||||
MDTG4 | 0.676 |
Extraction Method: Principal Component Analysis. Rotation Method: Varimax with Kaiser Normalization.
a. Rotation converged in 6 iterations.
KMO and Bartlett's Test
0.754 | ||
Bartlett's Test of Sphericity | Approx. Chi-Square | 109.722 |
df | 6 | |
Sig. | 0.000 |
Total Variance Explained
Initial Eigenvalues | Extraction Sums of Squared Loadings | |||||
Total | % of Variance | Cumulative % | Total | % of Variance | Cumulative % | |
1 | 2.155 | 53.883 | 53.883 | 2.155 | 53.883 | 53.883 |
2 | 0.655 | 16.373 | 70.256 | |||
3 | 0.614 | 15.359 | 85.615 | |||
4 | 0.575 | 14.385 | 100.000 |
Extraction Method: Principal Component Analysis.
Component Matrixa
Component | |
1 | |
DUTOAN3 | 0.748 |
DUTOAN1 | 0.734 |
DUTOAN2 | 0.727 |
DUTOAN4 | 0.727 |
Extraction Method: Principal Component Analysis.
a. 1 components extracted.
Model Summaryb
R | R Square | Adjusted R Square | Std. Error of the Estimate | Change Statistics | Durbin- Watson | |||||
R Square Change | F Change | df1 | df2 | Sig. F Change | ||||||
1 | 0.903a | 0.815 | 0.809 | 0.16180 | 0.815 | 136.345 | 5 | 155 | 0.000 | 2.015 |
a. Predictors: (Constant), QUYMO, PCLD, MDTG, QUYTRINH, UNGDUNG
b. Dependent Variable: DUTOAN
ANOVAa
Sum of Squares | df | Mean Square | F | Sig. | ||
1 | Regression | 17.848 | 5 | 3.570 | 136.345 | 0.000b |
Residual | 4.058 | 155 | 0.026 | |||
Total | 21.906 | 160 |
a. Dependent Variable: DUTOAN
b. Predictors: (Constant), QUYMO, PCLD, MDTG, QUYTRINH, UNGDUNG
Coefficientsa
Unstandardized Coefficients | Standardized Coefficients | t | Sig. | 95.0% Confidence Interval for B | Correlations | Collinearity Statistics | |||||||
B | Std. Error | Beta | Lower Bound | Upper Bound | Zero- order | Partial | Part | Tolerance | VIF | ||||
1 | (Constant) | -0.721 | 0.208 | 0.380 | -3.473 | 0.001 | -1.131 | -0.311 | 0.449 | 0.644 | 0.363 | 0.911 | 1.098 |
PCLD | 0.246 | 0.023 | 10.492 | 0.000 | 0.200 | 0.292 | |||||||
UNGDUNG | 0.325 | 0.037 | 0.326 | 8.884 | 0.000 | 0.253 | 0.397 | 0.493 | 0.581 | 0.307 | 0.888 | 1.126 | |
QUYTRINH | 0.194 | 0.021 | 0.336 | 9.361 | 0.000 | 0.153 | 0.235 | 0.354 | 0.601 | 0.324 | 0.930 | 1.076 | |
MDTG | 0.279 | 0.023 | 0.438 | 12.339 | 0.000 | 0.234 | 0.324 | 0.493 | 0.704 | 0.427 | 0.947 | 1.056 | |
QUYMO | 0.203 | 0.020 | 0.357 | 9.934 | 0.000 | 0.163 | 0.244 | 0.416 | 0.624 | 0.343 | 0.927 | 1.079 |
a. Dependent Variable: DUTOAN
Hình 4.3: Đồ thị Histogram của phần dư – đã chuẩn hóa
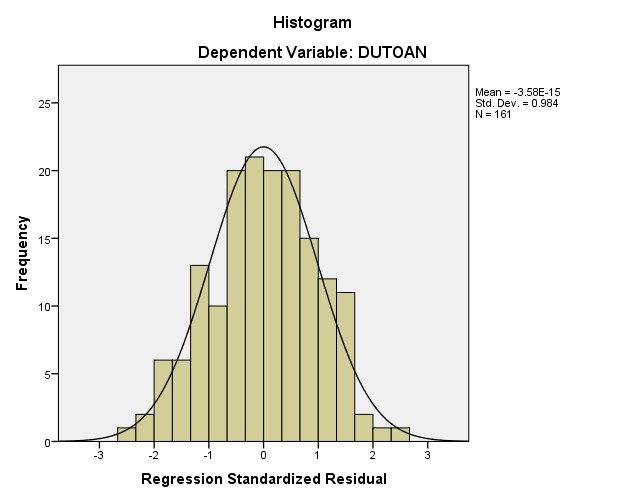
Nguồn: Phân tích dữ liệu
Hình 4.2: Đồ thị P-P Plot của phần dư – đã chuẩn hóa
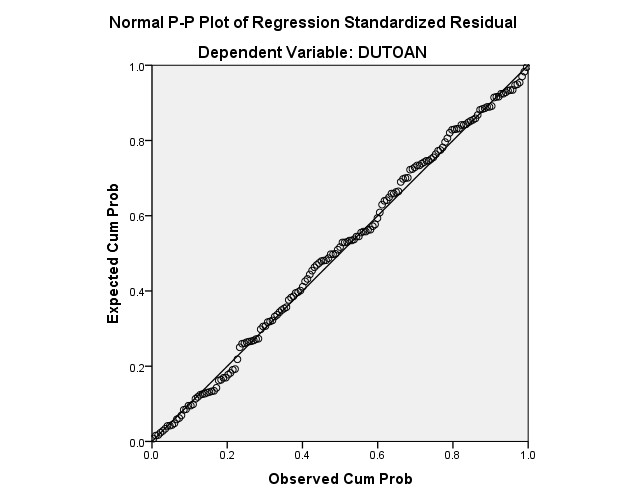
Nguồn: Phân tích dữ liệu
Hình 4.1: Đồ thị phân tán giữa giá trị dự đoán và phần dư từ hồi quy
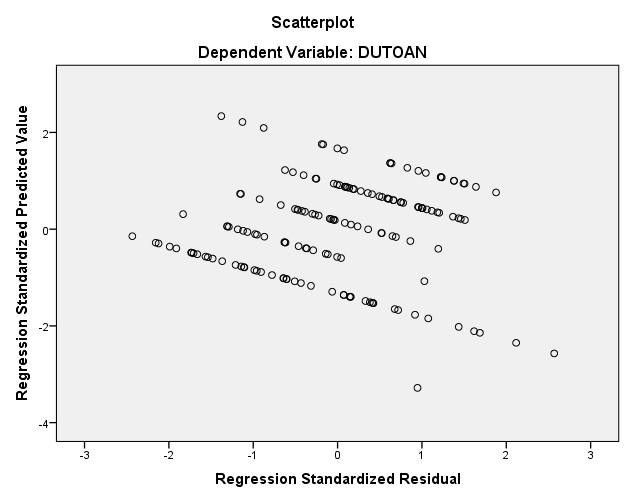
Nguồn: Phân tích dữ liệu