PHÂN TÍCH HỒI QUY TUYẾN TÍNH
Model | Unstandardized Coefficients | Standardized Coefficients | t | Sig. | ||
B | Std. Error | Beta | ||||
(Constant) | -.624 | .189 | -3.294 | .001 | ||
NT | .160 | .022 | .223 | 7.163 | .000 | |
CS | .055 | .021 | .079 | 2.625 | .009 | |
DTTDN | .177 | .022 | .251 | 8.101 | .000 | |
1 | NQT | .215 | .024 | .311 | 9.022 | .000 |
CSNN | .007 | .018 | .012 | .385 | .701 | |
GDDT | .178 | .032 | .176 | 5.520 | .000 | |
KH | .157 | .022 | .246 | 7.121 | .000 | |
TC | .242 | .032 | .270 | 7.657 | .000 | |
CN | -.010 | .020 | -.016 | -.516 | .606 | |
Có thể bạn quan tâm!
-

 Các Tiêu Chí Đánh Giá Chất Lượng Nhân Lực Quản Trị Tại Doanh Nghiệp Lữ Hành Quốc Tế
 -
 Phát triển nhân lực quản trị tại các doanh nghiệp lữ hành quốc tế của Hà Nội - 28
 -
 Phát triển nhân lực quản trị tại các doanh nghiệp lữ hành quốc tế của Hà Nội - 29
Xem toàn bộ 247 trang tài liệu này.
Kết quả hồi quy tuyến tính lần 1 Coefficientsa
Kết quả hồi quy tuyến tính lần 2 Model Summaryb
R | R Square | Adjusted R Square | Std. Error of the Estimate | Durbin- Watson | |
1 | .877a | .770 | .764 | .27076 | 2.045 |
b. Dependent Variable: PTNLQT |
ANOVAa
Sum of Squares | df | Mean Square | F | Sig. | ||
1 | Regressio n | 64.763 | 7 | 9.252 | 126.197 | .000b |
Residual | 19.355 | 264 | .073 | |||
Total | 84.118 | 271 |
b. Predictors: (Constant), TC, CS, DTTDN, NT, GDDT, NQT, KH |
Unstandardized Coefficients | Standardized Coefficients | t | Sig. | Collinearit y Statistics | |||
B | Std. Error | Beta | Tolerance | ||||
(Constant ) | -.646 | .166 | -3.882 | .000 | |||
NT | .159 | .022 | .222 | 7.170 | .000 | .909 | |
CS | .054 | .021 | .078 | 2.613 | .009 | .980 | |
1 | DTTDN | .178 | .022 | .252 | 8.154 | .000 | .915 |
NQT | .216 | .024 | .314 | 9.189 | .000 | .748 | |
GDDT | .180 | .032 | .178 | 5.601 | .000 | .864 | |
KH | .157 | .022 | .246 | 7.130 | .000 | .735 | |
TC | .243 | .031 | .270 | 7.707 | .000 | .708 |
Model
Model | Collinearity Statistics | |
VIF | ||
(Constant) | ||
NT | 1.100 | |
CS | 1.020 | |
1 | DTTDN | 1.093 |
NQT | 1.338 | |
GDDT | 1.157 | |
KH | 1.361 | |
TC | 1.413 | |
a. Dependent Variable: PTNLQT | ||
Collinearity Diagnosticsa
Dimensio n | Eigenvalu e | Condition Index | Variance Proportions | ||||
(Constant ) | NT | CS | DTTD N | ||||
1 | 7.772 | 1.000 | .00 | .00 | .00 | .00 | |
2 | .059 | 11.479 | .00 | .11 | .35 | .00 | |
3 | .050 | 12.507 | .00 | .51 | .19 | .17 | |
1 | 4 | .046 | 12.983 | .00 | .02 | .24 | .46 |
5 | .027 | 16.847 | .00 | .03 | .00 | .01 | |
6 | .021 | 19.331 | .03 | .18 | .02 | .30 | |
7 | .017 | 21.282 | .00 | .10 | .00 | .01 | |
8 | .008 | 31.239 | .97 | .04 | .19 | .05 |
Dimension | Variance Proportions | ||||
NQT | GDDT | KH | TC | ||
1 | .00 | .00 | .00 | .00 | |
2 | .07 | .00 | .19 | .00 | |
3 | .01 | .00 | .01 | .01 | |
1 | 4 | .02 | .01 | .16 | .00 |
5 | .82 | .04 | .33 | .00 | |
6 | .00 | .54 | .22 | .00 | |
7 | .07 | .05 | .09 | .96 | |
8 | .00 | .36 | .00 | .03 |
Model
a. Dependent Variable: PTNLQT
Residuals Statisticsa
Minimu m | Maximu m | Mean | Std. Deviation | N | |
Predicted Value | 2.2817 | 4.7519 | 3.6471 | .48885 | 272 |
Residual | -1.10289 | .93645 | .00000 | .26724 | 272 |
Std. Predicted Value | -2.793 | 2.260 | .000 | 1.000 | 272 |
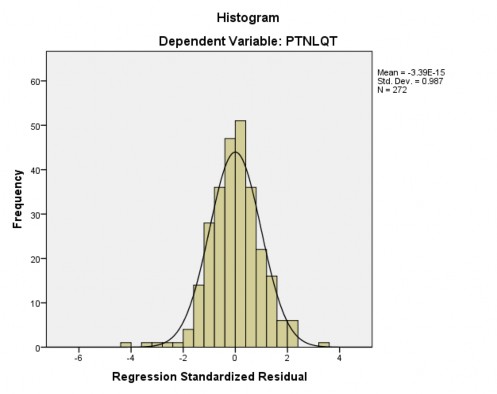
Std. Residual | -4.073 | 3.459 | .000 | .987 | 272 |
a. Dependent Variable: PTNLQT