Item-Total Statistics
Scale Mean if Item Deleted | Scale Variance if Item Deleted | Corrected Item-Total Correlation | Cronbach's Alpha if Item Deleted | |
CPMT1 | 5.96 | 3.150 | .723 | .802 |
CPMT2 | 6.00 | 3.294 | .679 | .820 |
CPMT3 | 5.92 | 2.951 | .649 | .835 |
CPMT4 | 6.00 | 2.840 | .741 | .792 |
Có thể bạn quan tâm!
-

 Thang Đo Nhân Tố Nhận Thức Về Kế Toán Quản Trị Chi Phí
 -
 Nghiên cứu các nhân tố ảnh hưởng đến công tác kế toán quản trị chi phí tại các doanh nghiệp khai thác đá ở Bình Dương - 17
 -
 Đơn Vị Công Tác: ………………………………………………….
 -
 Nghiên cứu các nhân tố ảnh hưởng đến công tác kế toán quản trị chi phí tại các doanh nghiệp khai thác đá ở Bình Dương - 20
 -
 Nghiên cứu các nhân tố ảnh hưởng đến công tác kế toán quản trị chi phí tại các doanh nghiệp khai thác đá ở Bình Dương - 21
Xem toàn bộ 175 trang tài liệu này.
Nhân tố trình độ nhân viên kế toán
Reliability Statistics
N of Items | |
.889 | 4 |
Item-Total Statistics
Scale Mean if Item Deleted | Scale Variance if Item Deleted | Corrected Item-Total Correlation | Cronbach's Alpha if Item Deleted | |
TDKT1 | 6.17 | 4.179 | .824 | .831 |
TDKT2 | 6.17 | 4.414 | .762 | .855 |
TDKT3 | 6.18 | 4.622 | .648 | .898 |
TDKT4 | 6.17 | 4.342 | .800 | .841 |
Nhân tố nhận thức về kế toán quản trị chi phí
Reliability Statistics
N of Items | |
.730 | 3 |
Item-Total Statistics
Scale Mean if Item Deleted | Scale Variance if Item Deleted | Corrected Item-Total Correlation | Cronbach's Alpha if Item Deleted | |
NTKT1 | 3.76 | 1.193 | .494 | .711 |
NTKT2 | 3.54 | 1.175 | .540 | .658 |
NTKT3 | 3.55 | 1.006 | .629 | .546 |
Nhân tố quan hệ giữa lợi ích và chi phí
Reliability Statistics
N of Items | |
.917 | 2 |
Item-Total Statistics
Scale Mean if Item Deleted | Scale Variance if Item Deleted | Corrected Item-Total Correlation | Cronbach's Alpha if Item Deleted | |
QHLC1 | 2.01 | .664 | .846 | . |
QHLC2 | 1.99 | .647 | .846 | . |
Nhân tố quy mô sản xuất
Reliability Statistics
N of Items | |
.975 | 6 |
Item-Total Statistics
Scale Mean if Item Deleted | Scale Variance if Item Deleted | Corrected Item-Total Correlation | Cronbach's Alpha if Item Deleted | |
QMSX1 | 10.36 | 11.274 | .951 | .968 |
QMSX2 | 10.35 | 11.187 | .965 | .966 |
QMSX3 | 10.35 | 11.036 | .872 | .976 |
QMSX4 | 10.30 | 11.052 | .910 | .971 |
QMSX5 | 10.28 | 11.159 | .880 | .974 |
QMSX6 | 10.37 | 11.175 | .945 | .968 |
Nhân tố hình thức sản xuất
Reliability Statistics
N of Items | |
.964 | 5 |
Item-Total Statistics
Scale Mean if Item Deleted | Scale Variance if Item Deleted | Corrected Item-Total Correlation | Cronbach's Alpha if Item Deleted |
7.87 | 10.201 | .860 | .961 | |
HTSX2 | 7.89 | 9.845 | .920 | .951 |
HTSX3 | 7.96 | 10.040 | .904 | .954 |
HTSX4 | 7.98 | 9.907 | .895 | .956 |
HTSX5 | 7.98 | 9.857 | .906 | .954 |
Nhân tố kết quả nghiên cứu
Reliability Statistics
N of Items | |
.840 | 6 |
Item-Total Statistics
Scale Mean if Item Deleted | Scale Variance if Item Deleted | Corrected Item-Total Correlation | Cronbach's Alpha if Item Deleted | |
KQNC1 | 10.33 | 14.039 | .640 | .809 |
KQNC2 | 10.41 | 14.344 | .679 | .802 |
KQNC3 | 10.23 | 15.184 | .568 | .823 |
KQNC4 | 10.34 | 15.185 | .564 | .824 |
KQNC5 | 10.33 | 14.339 | .607 | .816 |
KQNC6 | 10.33 | 14.087 | .644 | .808 |
Kiểm định KMO và Bartlett’s test Nhân tố Quy mô sản xuất
KMO and Bartlett's Test
.886 | ||
Approx. Chi-Square | 1165.590 | |
Bartlett's Test of Sphericity | df | 15 |
Sig. | .000 |
Total Variance Explained
Initial Eigenvalues | Extraction Sums of Squared Loadings | |||||
Total | % of Variance | Cumulative % | Total | % of Variance | Cumulative % | |
1 | 5.367 | 89.457 | 89.457 | 5.367 | 89.457 | 89.457 |
2 | .210 | 3.507 | 92.964 | |||
3 | .204 | 3.406 | 96.371 | |||
4 | .127 | 2.117 | 98.488 | |||
5 | .069 | 1.151 | 99.639 |
6
.022
.361
100.000
Extraction Method: Principal Component Analysis.
Nhân tố Hình thức sản xuất
KMO and Bartlett's Test
.902 | ||
Approx. Chi-Square | 717.416 | |
Bartlett's Test of Sphericity | df | 10 |
Sig. | .000 |
Total Variance Explained
Initial Eigenvalues | Extraction Sums of Squared Loadings | |||||
Total | % of Variance | Cumulative % | Total | % of Variance | Cumulative % | |
1 | 4.369 | 87.380 | 87.380 | 4.369 | 87.380 | 87.380 |
2 | .258 | 5.158 | 92.538 | |||
3 | .141 | 2.813 | 95.352 | |||
4 | .129 | 2.571 | 97.922 | |||
5 | .104 | 2.078 | 100.000 |
Extraction Method: Principal Component Analysis.
Kiểm định tổng nhân tố
Kaiser-Meyer-Olkin Measure of Sampling Adequacy. | .773 | |
Approx. Chi-Square | 3547.975 | |
Bartlett's Test of Sphericity | df | 465 |
Sig. | .000 | |
Total Variance Explained
Initial Eigenvalues | Extraction Sums of Squared Loadings | Rotation Sums of Squared Loadings | |||||||
Total | % of Variance | Cumulati ve % | Total | % of Varian ce | Cumul ative % | Total | % of Varian ce | Cumulati ve % | |
1 | 6.590 | 21.257 | 21.257 | 6.590 | 21.257 | 21.257 | 5.504 | 17.755 | 17.755 |
2 | 5.518 | 17.801 | 39.058 | 5.518 | 17.801 | 39.058 | 4.448 | 14.347 | 32.102 |
3 | 3.767 | 12.153 | 51.211 | 3.767 | 12.153 | 51.211 | 4.232 | 13.651 | 45.753 |
4 | 3.017 | 9.733 | 60.944 | 3.017 | 9.733 | 60.944 | 3.040 | 9.805 | 55.558 |
5 | 2.284 | 7.366 | 68.311 | 2.284 | 7.366 | 68.311 | 2.823 | 9.105 | 64.663 |
1.761 | 5.681 | 73.991 | 1.761 | 5.681 | 73.991 | 1.968 | 6.347 | 71.010 | |
7 | 1.400 | 4.516 | 78.507 | 1.400 | 4.516 | 78.507 | 1.786 | 5.763 | 76.773 |
8 | 1.192 | 3.845 | 82.352 | 1.192 | 3.845 | 82.352 | 1.729 | 5.579 | 82.352 |
9 | .617 | 1.989 | 84.341 | ||||||
10 | .549 | 1.772 | 86.113 | ||||||
11 | .502 | 1.618 | 87.730 | ||||||
12 | .455 | 1.466 | 89.197 | ||||||
13 | .434 | 1.399 | 90.596 | ||||||
14 | .359 | 1.159 | 91.755 | ||||||
15 | .331 | 1.066 | 92.821 | ||||||
16 | .269 | .868 | 93.689 | ||||||
17 | .252 | .811 | 94.501 | ||||||
18 | .247 | .795 | 95.296 | ||||||
19 | .210 | .677 | 95.973 | ||||||
20 | .193 | .623 | 96.596 | ||||||
21 | .173 | .559 | 97.154 | ||||||
22 | .167 | .539 | 97.693 | ||||||
23 | .143 | .461 | 98.153 | ||||||
24 | .134 | .432 | 98.585 | ||||||
25 | .109 | .351 | 98.936 | ||||||
26 | .092 | .296 | 99.233 | ||||||
27 | .070 | .225 | 99.458 | ||||||
28 | .068 | .220 | 99.677 | ||||||
29 | .047 | .153 | 99.831 | ||||||
30 | .038 | .123 | 99.953 | ||||||
31 | .015 | .047 | 100.000 |
Extraction Method: Principal Component Analysis.
Rotated Component Matrixa
Component | ||||||||
1 | 2 | 3 | 4 | 5 | 6 | 7 | 8 | |
CLKD1 | .843 | |||||||
CLKD2 | .917 | |||||||
CLKD3 | .869 | |||||||
CLKD4 | .879 | |||||||
CLKD5 | .913 | |||||||
QDPL1 | .911 | |||||||
QDPL2 | .919 | |||||||
CPMT1 | .830 | |||||||
CPMT2 | .820 |
.762 | ||||||
CPMT4 | .819 | |||||
TDKT1 | .899 | |||||
TDKT2 | .857 | |||||
TDKT3 | .790 | |||||
TDKT4 | .892 | |||||
NTKT1 | .744 | |||||
NTKT2 | .775 | |||||
NTKT3 | .830 | |||||
QHLC1 | .853 | |||||
QHLC2 | .880 | |||||
QMSX1 | .960 | |||||
QMSX2 | .967 | |||||
QMSX3 | .886 | |||||
QMSX4 | .911 | |||||
QMSX5 | .895 | |||||
QMSX6 | .951 | |||||
HTSX1 | .885 | |||||
HTSX2 | .933 | |||||
HTSX3 | .932 | |||||
HTSX4 | .925 | |||||
HTSX5 | .922 |
Extraction Method: Principal Component Analysis. Rotation Method: Varimax with Kaiser Normalization.
a. Rotation converged in 6 iterations.
Biến phụ thuộc “KQNC”
KMO and Bartlett's Test
.869 | ||
Approx. Chi-Square | 237.289 | |
Bartlett's Test of Sphericity | df | 15 |
Sig. | .000 |
Total Variance Explained
Initial Eigenvalues | Extraction Sums of Squared Loadings | |||||
Total | % of Variance | Cumulative % | Total | % of Variance | Cumulative % | |
1 | 3.340 | 55.671 | 55.671 | 3.340 | 55.671 | 55.671 |
2 | .659 | 10.976 | 66.647 | |||
3 | .593 | 9.883 | 76.530 | |||
4 | .577 | 9.624 | 86.154 |
.435 | 7.245 | 93.398 | |
6 | .396 | 6.602 | 100.000 |
Extraction Method: Principal Component Analysis.
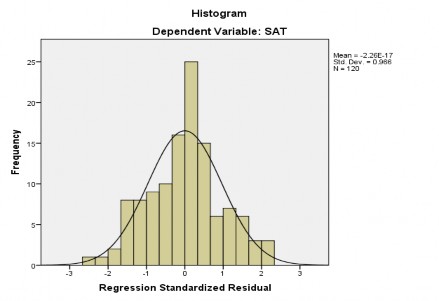
Phân tích hồi quy đa điểm
Model Summaryb
R | R Square | Adjusted R Square | Std. Error of the Estimate | Durbin-Watson | |
1 | .822a | .675 | .652 | .59018017 | 1.988 |
a. Predictors: (Constant), X8, X7, X6, X5, X4, X3, X2, X1
b. Dependent Variable: SAT
ANOVAa
Sum of Squares | df | Mean Square | F | Sig. | ||
Regression | 80.337 | 8 | 10.042 | 28.831 | .000b | |
1 | Residual | 38.663 | 111 | .348 | ||
Total | 119.000 | 119 |
a. Dependent Variable: SAT
b. Predictors: (Constant), X8, X7, X6, X5, X4, X3, X2, X1
Coefficientsa
Unstandardized Coefficients | Standardized Coefficients | t | Sig. | Collinearity Statistics | ||||
B | Std. Error | Beta | Tolerance | VIF | ||||
(Constant) | -3.148E- 017 | .054 | .000 | 1.000 | ||||
X1 | .352 | .054 | .352 | 6.510 | .000 | 1.000 | 1.000 | |
X2 | .300 | .054 | .300 | 5.541 | .000 | 1.000 | 1.000 | |
X3 | .264 | .054 | .264 | 4.885 | .000 | 1.000 | 1.000 | |
1 | X4 | .301 | .054 | .301 | 5.559 | .000 | 1.000 | 1.000 |
X5 | .309 | .054 | .309 | 5.718 | .000 | 1.000 | 1.000 | |
X6 | .330 | .054 | .330 | 6.095 | .000 | 1.000 | 1.000 | |
X7 | .202 | .054 | .202 | 3.737 | .000 | 1.000 | 1.000 | |
X8 | .236 | .054 | .236 | 4.358 | .000 | 1.000 | 1.000 |
a. Dependent Variable: SAT