11. Thủ tướng Chính phủ, 2006. Quyết định số 112/2006/QD-TTg về việc phê duyệt đề án phát triển ngành ngân hàng Việt Nam đến năm 2010 và định hướng đến năm 2020. Ngày 24 tháng 05 năm 2006.
12. Ngân hàng nhà nước, 2013. Thông tư số 02/2013/TT-NHNN về việc “Quy định về phân loại tài sản có, mức trích, phương pháp trích lập dự phòng rủi ro và việc sử dụng dự phòng để xử lý rủi ro trong hoạt động của tổ chức tín dụng, chi nhánh ngân hàng nước ngoài”. Hà Nội, ngày 21 tháng 01 năm 2013.
Danh mục tài liệu tiếng nước ngoài
1. Albertazzi, U. and Gambacorta, L, 2009. Bank profitability and the business cycle. Journal of Financial Stability, 5 (4), 393-409.
2. Alper, D. and Anbar A., 2011. Bank Specific and Macroeconomic Determinants of Commercial banks Profitability: Emperical Evidence from Turkey. Business and Economic Research Journal, Vol.2, No. 2.
3. Andreas Dietrich and Gabrielle Wanzenried, 2014. The Determinants of Commercial Banking Profitability in Low-, Middle-, and High-Income Countries. The Quarterly Review of Economics and Finance, 54: 337–354.
4. Arellano, M. and Bover, O., 1995. Another look at the instrumental variables estimation of error components mod- els. Journal of Econometrics, 68 (1): 29-51.
5. Athanasoglou et al., 2008. Banking-specific, industry-specific and macroeconomic determinants of banking profitability. Journal of International Financial Markets, Institutions and Money 18, 121–136.
6. Bashir, 2003. Determinants of profitability in Islamic banks: Some evidence from the Middle East. Islamic Economic Studies, Vol.1, No.1.
7. Ben Naceur, S. and Omran, M., 2011. The effects of bank regulations, competition, and financial reforms on banks’ performance. Emerging Markets Review, 12 (1): 1-20.
8. Berger, A.N., 1995. The relationship between capital and earnings in banking.
Journal of Money, Credit and Banking, 27 (2): 432-456.
9. Blundell, R. and Bond, S., 1998. Initial conditions and moment conditions in dynamic panel data models. Journal of Econometrics, 87 (1): 115-143.
10. Demirguc Kunt, A. & Huizinga, H., 1999. Determinants of commercial bank interest margins and profitability: Some International Evidence. World Bank Economic Review, 13: 379-408.
11. Dietrich, A., Wanzenried, G., 2014. The determinants of commercial banking profitability in low-, middle-, and high-income countries. The Quarterly Review of Economics and Finance, 54: 337 – 354.
12. Gambacorta, L. and Mistrulli, P., 2004. Does bank capital affect lending behavior?. Journal of Financial Interme- diation, 13 (4): 436-457.
13. Garcia-Herrero et al, 2009. What explains the low profitability of Chinese banks?. Journal of Banking and Finance, 33 (11): 2080-2092.
14. Golin, J. (2001). The bank credit analysis handbook: A guide for analysts, bankers and investors. Asia: John Wiley & Sons.
15. Gul, S. et al., 2011. Factors Affecting Bank Profitability in Pakistan. The Romanian Economic Journal, 29: 61 – 87.
16. Kosmidou, K., et al, 2007. Domestic and multinational determinants of foreign bank profits: the case of Greek banks operating abroad. Journal of Multinational Financial Management, 17: 1–15.
17. Marijana Ćuraka et al., 2011. Profitability Determinants of the Macedonian Banking Sector in Changing Environment. Elsevier Ltd. Selection.
18. Olson, D., and Zoubi, T., 2008. Using accounting ratios to distinguish between Islamic and conventional banks in the GCC region. International Journal of Accounting, 43: 45–65.
19. Olson, D., Zoubi, T., 2011. Efficiency and bank profitability in MENA countries. Emerging Markets Review, 12: 94 – 110.
20. Saeed, M., 2014. Bank – related, Industry – related and Macroeconomic Factors Affecting Bank Profitability: A Case of the United Kingdom. Research. Journal of Finance and Accounting, 2: 42 – 50.
21. Sufian, F. and Habibullahb, M., 2012. Globalizations and bank performance in China. Research in International Business and Finance, 26 (2): 221-239.
22. Van Horen, N., 2007. Foreign banks in developing countries; origin matters.
Emerging Markets Review 8, 81–105.
23. Wooldridge, Jeffrey M. 2002. Econometric Analysis of Cross-Section and Panel Data. Cambridge, Massachusetts: MIT Press.
Website
1. http://bidv.com.vn/
2. http://vietstock.vn/
3. http://www.acb.com.vn/
4. http://www.cafef.vn
5. http://www.sacombank.com.vn/
6. http://www.saga.vn
7. http://www.shb.com.vn/
8. http://www.tapchitaichinh.vn
9. http://www.vietcombank.com.vn/
10. http://www.vietinbank.vn/
11. http://www.vneconomy.vn
12. http://www.wikipedia.org
13. https://www.eximbank.com.vn/
14. https://www.gso.gov.vn/
15. https://www.mbbank.com.vn
PHỤ LỤC
Phụ lục 1: Mô tả thống kê các biến hồi quy
Năm | ROA | ROE | TCTR | LOAN TA | ETA | PROV ILOA N | GDP | |
VCB | 2007 | 0.0132 | 0.1943 | 0.2824 | 0.4941 | 0.0686 | 0.0216 | 0.0846 |
VCB | 2008 | 0.0064 | 0.0981 | 0.3149 | 0.5082 | 0.0621 | 0.0378 | 0.0631 |
VCB | 2009 | 0.0164 | 0.2571 | 0.3762 | 0.5543 | 0.0654 | 0.0327 | 0.0532 |
VCB | 2010 | 0.0152 | 0.2287 | 0.3943 | 0.575 | 0.0672 | 0.0322 | 0.0678 |
VCB | 2011 | 0.0124 | 0.17 | 0.3833 | 0.5711 | 0.0781 | 0.0254 | 0.0589 |
VCB | 2012 | 0.0113 | 0.1253 | 0.3987 | 0.5818 | 0.1002 | 0.0219 | 0.0503 |
VCB | 2013 | 0.0099 | 0.1038 | 0.4027 | 0.5849 | 0.0904 | 0.0235 | 0.0542 |
VCB | 2014 | 0.0088 | 0.1071 | 0.3965 | 0.5604 | 0.0751 | 0.0218 | 0.0598 |
ACB | 2007 | 0.0271 | 0.4449 | 0.2664 | 0.3725 | 0.0733 | 0.0042 | 0.0846 |
ACB | 2008 | 0.0232 | 0.3153 | 0.3753 | 0.3308 | 0.0738 | 0.0066 | 0.0631 |
ACB | 2009 | 0.0161 | 0.2463 | 0.3667 | 0.3714 | 0.0602 | 0.0081 | 0.0532 |
ACB | 2010 | 0.0125 | 0.2174 | 0.3935 | 0.4251 | 0.0555 | 0.0082 | 0.0678 |
ACB | 2011 | 0.0132 | 0.2749 | 0.4116 | 0.3658 | 0.0426 | 0.0096 | 0.0589 |
ACB | 2012 | 0.0034 | 0.0638 | 0.7319 | 0.5832 | 0.0716 | 0.0146 | 0.0503 |
ACB | 2013 | 0.0048 | 0.0658 | 0.6654 | 0.6434 | 0.0751 | 0.0144 | 0.0542 |
ACB | 2014 | 0.0055 | 0.0764 | 0.6379 | 0.6476 | 0.069 | 0.0136 | 0.0598 |
CTG | 2007 | 0.0076 | 0.1412 | 0.416 | 0.6152 | 0.0641 | 0.0167 | 0.0846 |
CTG | 2008 | 0.01 | 0.157 | 0.5702 | 0.6238 | 0.0637 | 0.0178 | 0.0631 |
CTG | 2009 | 0.0058 | 0.1023 | 0.5828 | 0.6693 | 0.0516 | 0.0095 | 0.0532 |
CTG | 2010 | 0.0111 | 0.2215 | 0.4857 | 0.6369 | 0.0494 | 0.0118 | 0.0678 |
CTG | 2011 | 0.0151 | 0.2676 | 0.4057 | 0.6371 | 0.0619 | 0.0103 | 0.0589 |
CTG | 2012 | 0.0128 | 0.1981 | 0.4296 | 0.662 | 0.0668 | 0.011 | 0.0503 |
CTG | 2013 | 0.0107 | 0.1321 | 0.4549 | 0.6529 | 0.0938 | 0.0088 | 0.0542 |
Có thể bạn quan tâm!
-
 Tương Quan Giữa Các Biến Trong Mô Hình Phân Tích 1
 -
 Biến Tỷ Lệ Dự Phòng Rủi Ro Tín Dụng Trên Tổng Dư Nợ
 -
 Giải Pháp Để Gia Tăng Lợi Nhuận Cho Các Nhtm Tại Việt Nam
 -
 Các nhân tố ảnh hưởng đến chỉ tiêu lợi nhuận của các ngân hàng thương mại Việt Nam - 11
Xem toàn bộ 97 trang tài liệu này.
2014 | 0.0092 | 0.1047 | 0.4672 | 0.6653 | 0.0832 | 0.0099 | 0.0598 | |
SHB | 2007 | 0.0185 | 0.0944 | 0.2805 | 0.3383 | 0.1761 | 0.0019 | 0.0846 |
SHB | 2008 | 0.0146 | 0.0876 | 0.3988 | 0.4348 | 0.1576 | 0.0041 | 0.0631 |
SHB | 2009 | 0.0152 | 0.136 | 0.3955 | 0.467 | 0.088 | 0.0099 | 0.0532 |
SHB | 2010 | 0.0126 | 0.1498 | 0.4573 | 0.4776 | 0.082 | 0.0112 | 0.0678 |
SHB | 2011 | 0.0123 | 0.1504 | 0.5052 | 0.4108 | 0.0821 | 0.0122 | 0.0589 |
SHB | 2012 | 0.0003 | 0.0034 | 0.5712 | 0.4886 | 0.0816 | 0.022 | 0.0503 |
SHB | 2013 | 0.0065 | 0.0856 | 0.7858 | 0.5327 | 0.0721 | 0.0155 | 0.0542 |
SHB | 2014 | 0.0051 | 0.0759 | 0.4987 | 0.6158 | 0.062 | 0.0101 | 0.0598 |
EIB | 2007 | 0.0178 | 0.1125 | 0.3479 | 0.5474 | 0.1867 | 0.004 | 0.0846 |
EIB | 2008 | 0.0174 | 0.0743 | 0.3185 | 0.4401 | 0.2662 | 0.0177 | 0.0631 |
EIB | 2009 | 0.0199 | 0.0865 | 0.352 | 0.5864 | 0.204 | 0.0099 | 0.0532 |
EIB | 2010 | 0.0185 | 0.1351 | 0.2799 | 0.4755 | 0.103 | 0.0101 | 0.0678 |
EIB | 2011 | 0.0193 | 0.2039 | 0.3062 | 0.4067 | 0.0888 | 0.0083 | 0.0589 |
EIB | 2012 | 0.0121 | 0.1332 | 0.4264 | 0.4403 | 0.0929 | 0.0081 | 0.0503 |
EIB | 2013 | 0.0039 | 0.0432 | 0.6528 | 0.4908 | 0.0864 | 0.0085 | 0.0542 |
EIB | 2014 | 0.0003 | 0.0039 | 0.6962 | 0.541 | 0.0873 | 0.0117 | 0.0598 |
MBB | 2007 | 0.0227 | 0.2058 | 0.3423 | 0.392 | 0.1198 | 0.0124 | 0.0846 |
MBB | 2008 | 0.019 | 0.178 | 0.3391 | 0.3549 | 0.0998 | 0.0157 | 0.0631 |
MBB | 2009 | 0.0193 | 0.1935 | 0.2955 | 0.4288 | 0.0998 | 0.0151 | 0.0532 |
MBB | 2010 | 0.0192 | 0.2171 | 0.3067 | 0.4451 | 0.081 | 0.0151 | 0.0678 |
MBB | 2011 | 0.0171 | 0.2296 | 0.3654 | 0.4253 | 0.0695 | 0.0185 | 0.0589 |
MBB | 2012 | 0.0147 | 0.2049 | 0.3451 | 0.4241 | 0.0733 | 0.0176 | 0.0503 |
MBB | 2013 | 0.0128 | 0.1625 | 0.3585 | 0.4864 | 0.084 | 0.0202 | 0.0542 |
MBB | 2014 | 0.013 | 0.1562 | 0.3749 | 0.5016 | 0.0826 | 0.0245 | 0.0598 |
STB | 2007 | 0.0313 | 0.2736 | 0.3036 | 0.5479 | 0.1138 | 0.005 | 0.0846 |
STB | 2008 | 0.0144 | 0.1264 | 0.5175 | 0.5115 | 0.1134 | 0.0072 | 0.0631 |
STB | 2009 | 0.0194 | 0.1825 | 0.4012 | 0.561 | 0.1045 | 0.0093 | 0.0532 |
2010 | 0.0146 | 0.1524 | 0.4214 | 0.5456 | 0.0961 | 0.0096 | 0.0678 | |
STB | 2011 | 0.0141 | 0.1447 | 0.5313 | 0.5693 | 0.1028 | 0.0101 | 0.0589 |
STB | 2012 | 0.0068 | 0.071 | 0.6062 | 0.6333 | 0.0901 | 0.015 | 0.0503 |
STB | 2013 | 0.0142 | 0.1449 | 0.5533 | 0.6851 | 0.1057 | 0.0122 | 0.0542 |
STB | 2014 | 0.0126 | 0.1256 | 0.5407 | 0.6745 | 0.0952 | 0.0107 | 0.0598 |
BID | 2007 | 0.0084 | 0.1588 | 0.306 | 0.6454 | 0.0569 | 0.022 | 0.0846 |
BID | 2008 | 0.0088 | 0.1577 | 0.5928 | 0.653 | 0.0547 | 0.0255 | 0.0631 |
BID | 2009 | 0.0104 | 0.1812 | 0.4467 | 0.6963 | 0.0595 | 0.0262 | 0.0532 |
BID | 2010 | 0.0113 | 0.1795 | 0.4827 | 0.694 | 0.0661 | 0.0208 | 0.0678 |
BID | 2011 | 0.0083 | 0.132 | 0.4316 | 0.7244 | 0.0601 | 0.0199 | 0.0589 |
BID | 2012 | 0.0073 | 0.1283 | 0.4057 | 0.7012 | 0.0547 | 0.0174 | 0.0503 |
BID | 2013 | 0.0078 | 0.1377 | 0.3871 | 0.7131 | 0.0584 | 0.0157 | 0.0542 |
BID | 2014 | 0.0083 | 0.1515 | 0.3937 | 0.6853 | 0.0512 | 0.0149 | 0.0598 |
Phụ lục 2: Mô tả các bước chạy mô hình hồi với ROA
1. Mô tả mẫu nghiên cứu

2. Phân tích tương quan

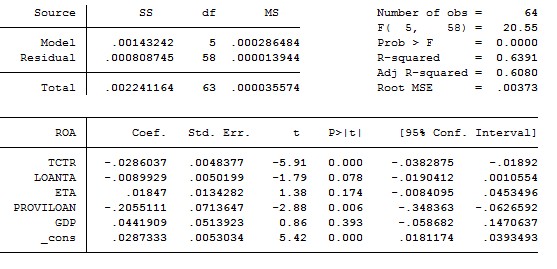
3. Hồi quy OLS với ROA

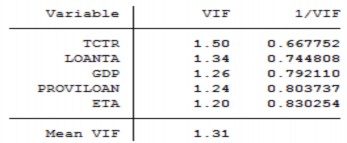
4. Hệ số VIF của mô hình 1

5. Kiểm định White của mô hình 1

6. Kiểm định Wooldridge của mô hình 1

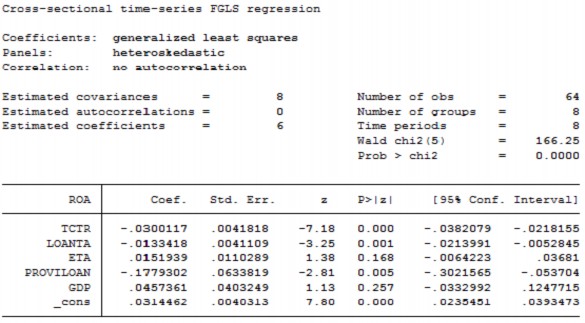
7. Kết quả hồi quy FGLS với ROA


