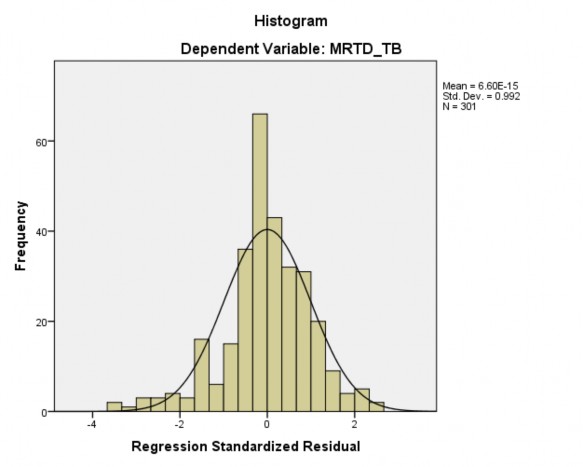
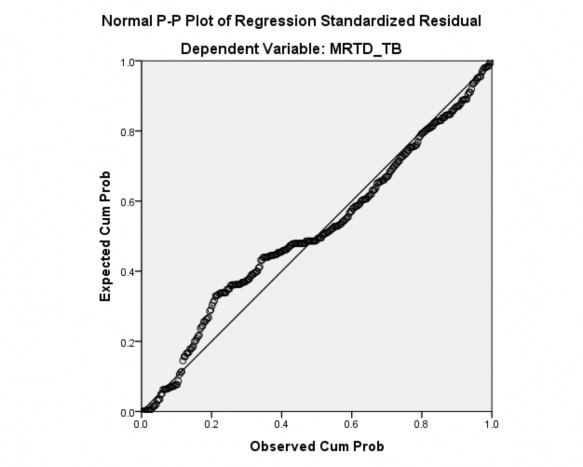
Case Processing Summary
N | % | ||
Cases | Valid | 301 | 100.0 |
Excludeda | 0 | 0.0 | |
Total | 301 | 100.0 |
Có thể bạn quan tâm!
-
 Giải Pháp Mở Rộng Tín Dụng Phát Triển Du Lịch Sinh Thái Tại Ngân Hàng Nông Nghiệp Và Phát Triển Nông Thôn Việt Nam - Chi Nhánh Bến Tre
 -
 Xin Vui Lòng Cho Biết Công Việc Hiện Nay Của Anh/ Chị
 -
 Thang Đo Khó Khăn Giao Dịch Tín Dụng Reliability Statistics
 -
 Tín dụng phát triển du lịch sinh thái tại Ngân hàng Nông nghiệp và Phát triển nông thôn Việt Nam – Chi nhánh Bến Tre - 16
Xem toàn bộ 130 trang tài liệu này.
a. Listwise deletion based on all variables in the procedure.
Reliability Statistics
N of Items | |
.670 | 3 |
Item-Total Statistics
Scale Mean if Item Deleted | Scale Variance if Item Deleted | Corrected Item- Total Correlation | Cronbach's Alpha if Item Deleted | |
MRTD1 | 7.94 | .779 | .443 | .650 |
MRTD2 | 7.99 | .920 | .556 | .501 |
MRTD3 | 8.12 | .888 | .473 | .587 |
PHỤ LỤC 5
KẾT QUẢ PHÂN TÍCH NHÂN TỐ CÁC THANG ĐO
Kaiser-Meyer-Olkin Measure of Sampling Adequacy. | .514 | |
Bartlett's Test of Sphericity | Approx. Chi- Square | 76.643 |
Df | 36 | |
Sig. | .000 | |
Total Variance Explained
Initial Eigenvalues | Extraction Sums of Squared Loadings | Rotation Sums of Squared Loadings | |||||||
Total | % of Variance | Cumulative % | Total | % of Variance | Cumulative % | Total | % of Variance | Cumulative % | |
1 | 7.895 | 31.582 | 31.582 | 7.895 | 31.582 | 31.582 | 5.589 | 22.358 | 22.358 |
2 | 4.447 | 17.789 | 49.371 | 4.447 | 17.789 | 49.371 | 4.903 | 19.611 | 41.969 |
3 | 3.454 | 13.815 | 63.187 | 3.454 | 13.815 | 63.187 | 4.319 | 17.276 | 59.245 |
4 | 2.847 | 11.387 | 74.574 | 2.847 | 11.387 | 74.574 | 3.720 | 14.882 | 74.126 |
5 | 1.765 | 7.059 | 81.633 | 1.765 | 7.059 | 81.633 | 1.877 | 7.507 | 81.633 |
6 | .742 | 2.969 | 84.602 | ||||||
7 | .587 | 2.349 | 86.951 | ||||||
8 | .567 | 2.269 | 89.220 | ||||||
9 | .533 | 2.130 | 91.351 | ||||||
10 | .422 | 1.689 | 93.039 | ||||||
11 | .385 | 1.538 | 94.578 | ||||||
12 | .256 | 1.025 | 95.603 | ||||||
13 | .221 | .884 | 96.486 | ||||||
14 | .162 | .648 | 97.134 | ||||||
15 | .151 | .604 | 97.738 | ||||||
16 | .138 | .550 | 98.288 | ||||||
17 | .122 | .489 | 98.777 | ||||||
18 | .094 | .374 | 99.151 | ||||||
19 | .087 | .347 | 99.498 | ||||||
20 | .058 | .231 | 99.729 | ||||||
21 | .036 | .143 | 99.872 | ||||||
22 | .023 | .090 | 99.963 | ||||||
23 | .009 | .037 | 100.000 | ||||||
24 | .000 | .000 | 100.000 | ||||||
25 | .000 | .000 | 100.000 |
Extraction Method: Principal Component Analysis.
Component | |||||
1 | 2 | 3 | 4 | 5 | |
CLTD4 | .909 | ||||
CLTD7 | .908 | ||||
CLTD2 | .908 | ||||
CLTD6 | .897 | ||||
CLTD5 | .897 | ||||
CLTD1 | .850 | ||||
CLTD3 | .799 | ||||
TCCTD6 | .960 | ||||
TCCTD5 | .957 | ||||
TCCTD1 | .954 | ||||
TCCTD3 | .927 | ||||
TCCTD2 | .782 | ||||
TCCTD4 | .628 | ||||
TTCTD1 | .919 | ||||
TTCTD2 | .910 | ||||
TTCTD3 | .910 | ||||
TTCTD4 | .903 | ||||
TTCTD5 | .882 | ||||
KKCTD2 | .958 | ||||
KKCTD1 | .956 | ||||
KKCTD4 | .947 | ||||
KKCTD3 | .946 | ||||
GCTD2 | .793 | ||||
GCTD1 | .784 | ||||
GCTD3 | .729 |
Extraction Method: Principal Component Analysis. Rotation Method: Varimax with Kaiser Normalization.
a. Rotation converged in 5 iterations. Component Transformation Matrix
1 | 2 | 3 | 4 | 5 | |
1 | .589 | .581 | .475 | .284 | .095 |
2 | .785 | -.484 | -.385 | -.004 | .025 |
3 | -.151 | .066 | -.407 | .892 | -.105 |
4 | -.050 | -.632 | .678 | .325 | -.183 |
5 | -.104 | -.156 | .047 | .130 | .972 |
Extraction Method: Principal Component Analysis. Rotation Method: Varimax with Kaiser Normalization.
PHỤ LỤC 6
KẾT QUẢ PHÂN TÍCH HỒI QUY
Correlations
MRTD _TB | TCCTD_ TB | TTCTD_ TB | KKCTD_ TB | CLTD_ TB | GCTD_ TB | ||
Pearson Correlation | 1 | .132* | .112 | -.034 | .301 | -.426** | |
MRTD_TB | Sig. (2-tailed) | .022 | .001 | .006 | .041 | .000 | |
N | 301 | 301 | 301 | 301 | 301 | 301 | |
TCCTD_TB | Pearson Correlation | .132* | 1 | .375** | .205** | .212** | .131* |
Sig. (2-tailed) | .022 | .000 | .000 | .000 | .023 | ||
N | 301 | 301 | 301 | 301 | 301 | 301 | |
TTCTD_TB | Pearson Correlation | .112 | .375** | 1 | .115* | .194** | .055 |
Sig. (2-tailed) | .001 | .000 | .045 | .001 | .341 | ||
N | 301 | 301 | 301 | 301 | 301 | 301 | |
KKCTD_T B | Pearson Correlation | -.034 | .205** | .115* | 1 | .172** | -.033 |
Sig. (2-tailed) | .006 | .000 | .045 | .003 | .570 | ||
N | 301 | 301 | 301 | 301 | 301 | 301 | |
CLTD_TB | Pearson Correlation | .301 | .212** | .194** | .172** | 1 | .119* |
Sig. (2-tailed) | .041 | .000 | .001 | .003 | .040 | ||
N | 301 | 301 | 301 | 301 | 301 | 301 | |
Pearson Correlation | -.426** | .131* | .055 | -.033 | .119* | 1 | |
GCTD_TB | Sig. (2-tailed) | .000 | .023 | .341 | .570 | .040 | |
N | 301 | 301 | 301 | 301 | 301 | 301 |
*. Correlation is significant at the 0.05 level (2-tailed).
**. Correlation is significant at the 0.01 level (2-tailed).
Model Summaryb
R | R Square | Adjusted R Square | Std. Error of the Estimate | Change Statistics | Durbin- Watson |
R Square Change | F Change | df1 | df2 | Sig. F Change |
.739a | .692 | .679 | .38990 | .192 | 14.058 | 5 | 295 | .000 | 1.940 |
a. Predictors: (Constant), GCTD_TB, KKCTD_TB, TTCTD_TB, CLTD_TB,
TCCTD_TB
b. Dependent Variable: MRTD_TB
Coefficientsa
Unstandardized Coefficients | Standardized Coefficients | t | Sig. | Collinearity Statistics | ||||
B | Std. Error | Beta | Tolerance | VIF | ||||
(Constant) | 2.324 | 0.276 | 8.426 | 0.000 | ||||
TCCTD_TB | -0.241 | 0.038 | -0.269 | -6.342 | 0.005 | .808 | 1.237 | |
TTCTD_TB | 0.231 | 0.04 | 0.272 | 5.775 | 0.004 | .845 | 1.183 | |
1 | KKCTD_TB | -0.132 | 0.038 | -0.148 | -3.474 | 0.005 | .935 | 1.070 |
CLTD_TB | 0.230 | 0.043 | 0.291 | 5.349 | 0.000 | .914 | 1.094 | |
GCTD_TB | -0.352 | 0.046 | -0.476 | -7.652 | 0.000 | .969 | 1.032 |
a. Dependent Variable: MRTD_TB


