APPENDIX 7
Testing the scale through Cronbach's alpha coefficient
TRUST
Reliability Statistics
| Cronbach's Alpha | N of Items |
| .941 | 6 |
Maybe you are interested!
-
 Evaluation of customer satisfaction for service quality at Saigon Commercial Joint Stock Bank after consolidation - 10
 -
 Evaluation Of Service Quality At Branches, Transaction Offices, Savings Funds At Scb
 -
 Evaluation of customer satisfaction for service quality at Saigon Commercial Joint Stock Bank after consolidation - 12
 -
 Evaluation of customer satisfaction for service quality at Saigon Commercial Joint Stock Bank after consolidation - 14
 -
 Evaluation of customer satisfaction for service quality at Saigon Commercial Joint Stock Bank after consolidation - 15
 -
 Evaluation of customer satisfaction for service quality at Saigon Commercial Joint Stock Bank after consolidation - 16

Item-Total Statistics
| Scale Mean if Item Deleted | Scale Variance if Item Deleted | Corrected Item- Total Correlation | Cronbach's Alpha if Item Deleted | |
| TC1S | 17.6026 | 15,185 | .835 | .928 |
| TC2S | 17.4915 | 14,998 | .821 | .929 |
| TC3S | 17.6325 | 14.688 | .818 | .930 |
| TC4S | 17.5940 | 15.375 | .784 | .934 |
| TC5S | 17.8034 | 15,850 | .797 | .933 |
| TC6S | 17.5171 | 14.131 | .882 | .922 |
RESPONSE
Reliability Statistics
| Cronbach's Alpha | N of Items |
| .934 | 9 |
Item-Total Statistics
| Scale Mean if Item Deleted | Scale Variance if Item Deleted | Corrected Item- Total Correlation | Cronbach's Alpha if Item Deleted | |
| DU7S | 33.0598 | 24.469 | .837 | .921 |
| DU8S | 33.1239 | 26.418 | .564 | .938 |
| DU9S | 31.9060 | 24,755 | .825 | .922 |
| DU10S | 32.0256 | 24.489 | .891 | .918 |
| DU11S | 32,0128 | 25,060 | .838 | .921 |
| DU12S | 32.1026 | 25.346 | .763 | .926 |
| DU13S | 31.9658 | 26.522 | .682 | .930 |
| DU14S | 32.1325 | 25.326 | .724 | .928 |
| DU15S | 32.0641 | 25,794 | .672 | .931 |
SERVICE CAPABILITIES
Reliability Statistics
| Cronbach's Alpha | N of Items |
| .925 | 6 |
Item-Total Statistics
| Scale Mean if Item Deleted | Scale Variance if Item Deleted | Corrected Item- Total Correlation | Cronbach's Alpha if Item Deleted | |
| NL16S | 18.5513 | 14,798 | .820 | .910 |
| NL17S | 18.6624 | 12.783 | .850 | .902 |
| NL18S | 18.8718 | 12,911 | .900 | .894 |
| NL19S | 18.7692 | 14,273 | .754 | .915 |
| NL20S | 19.3462 | 15.523 | .488 | .948 |
| NL21S | 18.8547 | 12,554 | .937 | .888 |
EMPATHETIC
Reliability Statistics
| Cronbach's Alpha | N of Items |
| .949 | 6 |
Item-Total Statistics
| Scale Mean if Item Deleted | Scale Variance if Item Deleted | Corrected Item- Total Correlation | Cronbach's Alpha if Item Deleted | |
| DC22S | 19.0342 | 17,037 | .904 | .931 |
| DC23S | 18.9744 | 17.373 | .917 | .930 |
| DC24S | 18.6538 | 17.712 | .866 | .936 |
| DC25S | 19.0470 | 18,388 | .710 | .955 |
| DC26S | 19.3419 | 17,908 | .798 | .944 |
| DC27S | 18.5385 | 17.838 | .868 | .936 |
TANGIBLE MEDIA
Reliability Statistics
| Cronbach's Alpha | N of Items |
| .955 | 7 |
Item-Total Statistics
| Scale Mean if Item Deleted | Scale Variance if Item Deleted | Corrected Item- Total Correlation | Cronbach's Alpha if Item Deleted | |
| PT28S | 23.5812 | 25,798 | .844 | .948 |
| PT29S | 23.3803 | 24.683 | .924 | .941 |
| PT30S | 23.4316 | 23,800 | .906 | .943 |
| PT31S | 23.0470 | 25,753 | .926 | .941 |
| PT32S | 23.6496 | 27.147 | .841 | .949 |
| PT33S | 23.7949 | 29,039 | .569 | .968 |
| PT34S | 23.0641 | 25,811 | .929 | .941 |
CUSTOMER SATISFACTION
| Cronbach's Alpha | N of Items |
| .947 | 5 |
| Scale Mean if Item Deleted | Scale Variance if Item Deleted | Corrected Item- Total Correlation | Cronbach's Alpha if Item Deleted | |
| MEET NEEDS | 15.5897 | 8.131 | .900 | .936 |
| UU TIEN LUA CHON | 15.2137 | 9.542 | .856 | .934 |
| CAM KET DELIVERY ONLY | 14.3120 | 9,941 | .894 | .929 |
| DIFFERENT DIFFERENCE | 14.3376 | 9.847 | .897 | .928 |
| MUC FOR MANUAL | 14.9402 | 11.138 | .831 | .945 |
Reliability Statistics
Item-Total Statistics
APPENDIX 8
EFA . exploratory factor analysis
Exploratory factor analysis EFA scales service quality components
Initial result
KMO and Bartlett's Test
| Kaiser-Meyer-Olkin Measure of Sampling Adequacy. | .894 |
| Bartlett's Test of Sphericity Approx. Chi-Square | 1.224E4 |
| DF | 561 |
| Sig. | .000 |
Result of factor formation:
Pattern Matrix
| Factor | ||||||
| first | 2 | 3 | 4 | 5 | 6 | |
| DC24S | .985 | |||||
| DC22S | .980 | |||||
| DC23S | .937 | |||||
| DC26S | .803 | |||||
| DC27S | .656 | .326 | ||||
| DC25S | .577 | |||||
| DU14S | .520 | |||||
| NL20S | .358 | |||||
| PT33S | .352 | |||||
| PT28S | .881 | |||||
| PT34S | .854 | |||||
| PT31S | .823 | |||||
| PT30S | .815 | |||||
| PT32S | .754 | |||||
| PT29S | .662 | |||||
| DU11S | .346 | .878 | ||||
| DU9S | .851 | |||||
| DU13S | .851 | |||||
| DU12S | .802 | |||||
| DU10S | .745 | |||||
| DU7S | .693 | .507 | ||||
| DU15S | .317 | .396 | ||||
| TC5S | .984 | |||||
| TC1S | .860 | |||||
| TC2S | .846 | |||||
| TC4S | .770 | |||||
| TC3S | .756 | |||||
| TC6S | .319 | .710 | ||||
| NL16S | .972 | |||||
| NL21S | .878 | |||||
| NL17S | .873 | |||||
| NL18S | .824 | |||||
| NL19S | .783 | |||||
| DU8S | .484 | .768 |
Extraction Method: Principal Axis Factoring.
Rotation Method: Promax with Kaiser Normalization.
Rotation converged in 8 iterations.
Table of results after 7 times of factor analysis
| Factor Analysis (Times) | KMO . coefficient | Number of factors to be extracted | Extracted variance (>50%) | Discarded variable |
| first | 0.894 | 6 | 78.37 | PT33S |
| 2 | 0.890 | 6 | 79.30 | NL20S |
| 3 | 0.886 | 6 | 80.27 | DU15S |
| 4 | 0.891 | 5 | 77.59 | DU14S |
| 5 | 0.885 | 5 | 77.55 | DC25S |
| 6 | 0.879 | 5 | 78.09 | DC27S |
| 7 | 0.873 | 5 | 77.99 |
Result of the 7th factor analysis:
KMO and Bartlett's Test
| Kaiser-Meyer-Olkin Measure of Sampling Adequacy. | .873 |
| Bartlett's Test of Sphericity Approx. Chi-Square | 9.860E3 |
| DF | 378 |
| Sig. | .000 |
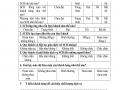
EFA analysis results of service components scale:
| Pattern Matrix | ||||||||
| Factor | ||||||||
| first | 2 | 3 | 4 | 5 | Eigenvalues | Method wrong deduction | Factor name | |
| PT34S | 0.94 | 15.06 | 53.79 | TANGIBLE MEDIA | ||||
| PT31S | 0.93 | |||||||
| PT30S | 0.89 | |||||||
| PT28S | 0.79 | |||||||
| PT32S | 0.75 | |||||||
| PT29S | 0.71 | |||||||
| DU7S | 0.88 | 2.19 | 7.83 | ABILITY TO MEET | ||||
| DU12S | 0.85 | |||||||
| DU11S | 0.81 | 0.34 | ||||||
| DU10S | 0.79 | |||||||
| DU8S | -0.35 | 0.78 | ||||||
| DU9S | 0.74 | |||||||
| DU13S | 0.71 | |||||||
| TC5S | 0.88 | 1.97 | 7.03 | RELIABILITY | ||||
| TC3S | 0.84 | |||||||
| TC2S | 0.82 | |||||||
| TC4S | 0.79 | |||||||
| TC1S | 0.69 | |||||||
| TC6S | 0.64 | 0.31 | ||||||
| NL16S | 0.90 | 1.53 | 5.47 | SERVICE CAPABILITIES | ||||
| NL17S | 0.90 | |||||||
| NL21S | 0.88 | |||||||
| NL18S | 0.83 | |||||||
| NL19S | 0.81 | |||||||
| DC22S | 0.89 | 1.08 | 3.87 | EMPATHY | ||||
| DC23S | 0.84 | |||||||
| DC24S | 0.81 | |||||||
| DC26S | 0.74 | |||||||
| Extraction Method: Principal Axis Factoring. | ||||||||
| Rotation Method: Promax with Kaiser Normalization. | ||||||||
a. Rotation converged in 6 iterations.
Exploratory factor analysis EFA satisfaction scale
KMO and Bartlett's Test
| Kaiser-Meyer-Olkin Measure of Sampling Adequacy. | .818 |
| Bartlett's Test of Sphericity Approx. Chi-Square | 1.660E3 |
| DF | ten |
| Sig. | .000 |
Total Variance Explained
| Factor | Initial | Eigenvalues | Extraction Sums of Squared Loadings | |||
| Total | % of Variance | Cumulative % | Total | % of Variance | Cumulative % | |
| first | 4.243 | 84,869 | 84,869 | 4.059 | 81,183 | 81,183 |
| 2 | .394 | 7.879 | 92.748 | |||
| 3 | .253 | 5.067 | 97.815 | |||
| 4 | .090 | 1,791 | 99.606 | |||
| 5 | .020 | .394 | 100,000 won | |||
Extraction Method: Principal Axis Factoring.
Factor Matrix
| Factor | |
| first | |
| DIFFERENT DIFFERENCE | .934 |
| CAM KET DELIVERY ONLY | .931 |
| MEET NEEDS | .919 |
| UU TIEN LUA CHON | .864 |
| MUC FOR MANUAL | .852 |
Extraction Method: Principal Axis Factoring.
1 factors extracted. 6 iterations required.
APPENDIX 9
Test the research model by multiple regression analysis
Correlation analysis
Correlations
| SU THANH MAN KHACH HANG | PHUONG TIEN HUU HIGHLIGHTS | DAP UNG | HOT NEWS | FUCKING FUCKING LUCK | SYMPATHY | ||
| SUPPLY Pearson MAN KHACH Correlation | first | .699** | .670** | .635** | .646** | .763** | |
| CAVE | Sig. (2-tailed) | .000 | .000 | .000 | .000 | .000 | |
| WOMEN | 234 | 234 | 234 | 234 | 234 | 234 | |
| PHUONG TIEN HU | Pearson Correlation | .699** | first | .564** | .514** | .628** | .648** |
| HIM | Sig. (2-tailed) | .000 | .000 | .000 | .000 | .000 | |
| WOMEN | 234 | 234 | 234 | 234 | 234 | 234 | |
| DAP UNG | Pearson Correlation | .670** | .564** | first | .545** | .504** | .571** |
| Sig. (2-tailed) | .000 | .000 | .000 | .000 | .000 | ||
| WOMEN | 234 | 234 | 234 | 234 | 234 | 234 | |
| HOT NEWS | Pearson Correlation | .635** | .514** | .545** | first | .543** | .630** |
| Sig. (2-tailed) | .000 | .000 | .000 | .000 | .000 | ||
| WOMEN | 234 | 234 | 234 | 234 | 234 | 234 | |
| FUCKING FUCKING LUCK | Pearson Correlation | .646** | .628** | .504** | .543** | first | .625** |
| Sig. (2-tailed) | .000 | .000 | .000 | .000 | .000 | ||
| WOMEN | 234 | 234 | 234 | 234 | 234 | 234 | |
| SYMPATHY | Pearson Correlation | .763** | .648** | .571** | .630** | .625** | first |
| Sig. (2-tailed) | .000 | .000 | .000 | .000 | .000 | ||
| WOMEN | 234 | 234 | 234 | 234 | 234 | 234 | |
**. Correlation is significant at the 0.01 level (2- tailed).
The results of multiple linear regression analysis
Model Summaryb
| Model | CHEAP | R Square | Adjusted R Square | Std. Error of the Estimate |
| first | .847a | .717 | .711 | .52696042 |
ANOVAb
| Model | Sum of Squares | DF | Mean Square | F | Sig. | |
| first | Regression | 160.521 | 5 | 32.104 | 115.613 | .000a |
| Residual | 63,313 | 228 | .278 | |||
| Total | 223.834 | 233 | ||||
Coefficientsa
| Model | Unstandardized Coefficients | Standardized Coefficients | t | Sig. | Collinearity | Statistics | ||
| REMOVE | Std. Error | Beta | Tolerance | VIF | ||||
| first | (Constant) | 6,200E-16 | .034 | .000 | 1,000 yen | |||
| PHUONG TIEN HUU HIGHLIGHTS | .207 | .051 | .210 | 4.083 | .000 | .467 | 2.139 | |
| DAP UNG | .228 | .046 | .229 | 4.898 | .000 | .567 | 1,765 | |
| HOT NEWS | .119 | .048 | .119 | 2.464 | .014 | .531 | 1.884 | |
| FUCKING FUCKING LUCK | .114 | .049 | .116 | 2.330 | .021 | .500 | 1,998 | |
| SYMPATHY | .346 | .054 | .348 | 6.389 | .000 | .417 | 2.398 | |
a. Dependent Variable: SUCCESSFUL
PRODUCTS
Predictors: (Constant), DONG CAM, DAP UNG, SUCCESSFUL, SPECIAL NEWS, PHUONG TIEN HUU HIGH DEVELOPMENT
Dependent Variable: SUCCESSFUL HANG
Predictors: (Constant) , DONG CAM, DAP UNG, NANG LUC PHUC VU, PHUONG TIEN HUU HINH
Dependent Variable: