PHỤ LỤC 4 KẾT QUẢ KIỂM ĐỊNH THANG ĐO
Biến Quyết định nhà quản trị
Reliability Statistics
Cronbach's Alpha Based on Standardized Items | N of Items | |
.773 | .775 | 4 |
Có thể bạn quan tâm!
-
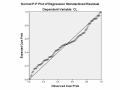
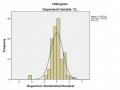
 Kiểm Tra Giả Định Các Phần Dư Có Phân Phối Chuẩn
 -
 Các yếu tố ảnh hưởng đến chất lượng báo cáo tài chính của doanh nghiệp nhỏ và vừa tại thành phố Hồ Chí Minh - 12
 -
 Các yếu tố ảnh hưởng đến chất lượng báo cáo tài chính của doanh nghiệp nhỏ và vừa tại thành phố Hồ Chí Minh - 13
 -
 Các yếu tố ảnh hưởng đến chất lượng báo cáo tài chính của doanh nghiệp nhỏ và vừa tại thành phố Hồ Chí Minh - 15
Xem toàn bộ 120 trang tài liệu này.

Item-Total Statistics
Scale Mean if Item Deleted | Scale Variance if Item Deleted | Corrected Item-Total Correlation | Squared Multiple Correlation | Cronbach's Alpha if Item Deleted | |
NQT1 | 11.63 | 1.624 | .621 | .636 | .699 |
NQT2 | 11.61 | 1.790 | .631 | .593 | .688 |
NQT3 | 11.53 | 1.999 | .587 | .547 | .716 |
NQT4 | 11.53 | 2.161 | .486 | .495 | .762 |
Biến Chính sách pháp luật
Reliability Statistics
Cronbach's Alpha Based on Standardized Items | N of Items | |
.863 | .863 | 4 |
Item-Total Statistics
Scale Mean if Item Deleted | Scale Variance if Item Deleted | Corrected Item-Total Correlatio n | Squared Multiple Correlation | Cronbach's Alpha if Item Deleted | |
PL1 | 11.84 | 2.010 | .786 | .646 | .793 |
PL2 | 11.89 | 2.097 | .698 | .496 | .830 |
PL3 | 11.91 | 2.046 | .744 | .598 | .811 |
PL4 | 11.74 | 2.248 | .617 | .381 | .862 |
Biến Trách nhiệm nhân viên kế toán
Reliability Statistics
Cronbach's Alpha Based on Standardized Items | N of Items | |
.873 | .873 | 5 |
Item-Total Statistics
Scale Mean if Item Deleted | Scale Variance if Item Deleted | Corrected Item-Total Correlation | Squared Multiple Correlation | Cronbach's Alpha if Item Deleted | |
KT1 | 15.65 | 1.472 | .761 | .749 | .831 |
KT2 | 15.64 | 1.511 | .800 | .698 | .821 |
KT3 | 15.65 | 1.706 | .536 | .372 | .886 |
KT4 | 15.66 | 1.776 | .604 | .409 | .868 |
KT5 | 15.64 | 1.493 | .824 | .812 | .815 |
Biến Thuế
Reliability Statistics
Cronbach's Alpha Based on Standardized Items | N of Items | |
.762 | .768 | 3 |
Item-Total Statistics
Scale Mean if Item Deleted | Scale Variance if Item Deleted | Corrected Item-Total Correlation | Squared Multiple Correlation | Cronbach's Alpha if Item Deleted | |
THUE1 | 7.99 | 1.144 | .529 | .286 | .762 |
THUE2 | 7.88 | 1.203 | .657 | .446 | .619 |
THUE3 | 7.96 | 1.152 | .606 | .406 | .666 |
Biến chất lượng BCTC
Reliability Statistics
Cronbach's Alpha Based on Standardized Items | N of Items | |
.848 | .849 | 5 |
Item-Total Statistics
Scale Mean if Item Deleted | Scale Variance if Item Deleted | Corrected Item-Total Correlation | Squared Multiple Correlation | Cronbach's Alpha if Item Deleted | |
CL1 | 16.29 | 3.197 | .639 | .442 | .823 |
CL2 | 16.35 | 3.022 | .777 | .641 | .784 |
CL3 | 16.30 | 3.330 | .667 | .504 | .815 |
CL4 | 16.19 | 3.361 | .568 | .338 | .841 |
CL5 | 16.34 | 3.307 | .646 | .439 | .820 |
PHỤ LỤC 5: THỐNG KÊ MÔ TẢ CÁC YẾU TỐ ẢNH HƯỞNG TỚI CLBCTC
Descriptive Statistics
N | Minimu m | Maximu m | Mean | Std. Deviation | Skewness | K | urtosis | ||
Statistic | Statistic | Statistic | Statistic | Statistic | Statistic | Std. Error | Statistic | Std. Error | |
NQT | 112 | 12.00 | 20.00 | 15.4286 | 1.76918 | .090 | .228 | .431 | .453 |
THUE | 112 | 6.00 | 15.00 | 11.9196 | 1.53129 | -.859 | .228 | 3.370 | .453 |
CL | 112 | 9 | 25 | 20.37 | 2.210 | -1.889 | .228 | 9.113 | .453 |
KT | 112 | 14.0 | 25.0 | 19.562 | 1.5526 | -1.560 | .228 | 5.310 | .453 |
PL | 112 | 8.00 | 20.00 | 15.7946 | 1.88946 | -.865 | .228 | 2.348 | .453 |
TIMEMH | 112 | 1 | 3 | 2.03 | .561 | .010 | .228 | .264 | .453 |
tong tai san | 112 | 3820 | 45392 | 15846.83 | 7447.146 | 1.919 | .228 | 4.091 | .453 |
ty suat loi nhuan | 112 | 1.63 | 21.85 | 6.6436 | 3.28602 | 1.717 | .228 | 4.498 | .453 |
Valid N (listwise) | 112 |
PHỤ LỤC 6 PHÂN TÍCH NHÂN TỐ EFA
Phân tích EFA các biến độc lập
Kaiser-Meyer-Olkin Measure of Sampling Adequacy.
Approx. Chi-Square
.663
996.677
171
.000
KMO and Bartlett's Test
Bartlett's Test of Sphericity
df
Sig.
Total Variance Explained
Initial | Eigenvalues | Rotation Sums of Squared Loadings | ||||
Total | % of Variance | Cumulative % | Total | % of Variance | Cumulative % | |
1 | 4.730 | 24.896 | 24.896 | 3.431 | 18.060 | 18.060 |
2 | 2.570 | 13.527 | 38.423 | 2.962 | 15.588 | 33.649 |
3 | 2.050 | 10.788 | 49.211 | 2.287 | 12.035 | 45.684 |
4 | 1.600 | 8.419 | 57.630 | 2.121 | 11.164 | 56.848 |
5 | 1.316 | 6.925 | 64.555 | 1.260 | 6.631 | 63.479 |
6 | 1.067 | 5.616 | 70.171 | 1.197 | 6.302 | 69.781 |
7 | 1.040 | 5.475 | 75.646 | 1.114 | 5.865 | 75.646 |
8 | .786 | 4.139 | 79.785 | |||
9 | .719 | 3.784 | 83.569 | |||
10 | .545 | 2.866 | 86.435 | |||
11 | .514 | 2.707 | 89.142 | |||
12 | .451 | 2.374 | 91.516 | |||
13 | .402 | 2.118 | 93.634 | |||
14 | .320 | 1.682 | 95.316 | |||
15 | .270 | 1.422 | 96.738 | |||
16 | .212 | 1.114 | 97.852 | |||
17 | .193 | 1.014 | 98.866 | |||
18 | .118 | .619 | 99.485 | |||
19 | .098 | .515 | 100.000 |
Extraction Method: Principal Component Analysis.
Phân tích EFA biến phụ thuộc
Kaiser-Meyer-Olkin Measure of Sampling Adequacy.
Approx. Chi-Square
Bartlett's Test of
.827
228.463
10
.000
KMO and Bartlett's Test
Sphericity
df
Sig.
Total Variance Explained
Initial | Eigenv | lues | |
Total | % of Variance | Cumulative % | |
1 | 3.130 | 62.596 | 62.596 |
2 | .631 | 12.621 | 75.217 |
3 | .528 | 10.555 | 85.772 |
4 | .454 | 9.084 | 94.856 |
5 | .257 | 5.144 | 100.000 |
Extraction Method: Principal Component Analysis.
PHỤ LỤC 7: PHÂN TÍCH TƯƠNG QUAN GIỮA CÁC BIẾN
Correlations
CL | KT | PL | THUE | LOGROE | LOGSIZ E | NQT | TIMEMH | ||
Pearson Correlation | 1 | .496** | .577** | .198* | .218* | .208* | .423** | .210* | |
CL | Sig. (2-tailed) | .000 | .000 | .037 | .021 | .028 | .000 | .026 | |
N | 112 | 112 | 112 | 112 | 112 | 112 | 112 | 112 | |
Pearson Correlation | .496** | 1 | .279** | .129 | .065 | .115 | .246** | .003 | |
KT | Sig. (2-tailed) | .000 | .003 | .175 | .497 | .225 | .009 | .973 | |
N | 112 | 112 | 112 | 112 | 112 | 112 | 112 | 112 | |
Pearson Correlation | .577** | .279** | 1 | .016 | .080 | -.019 | .409** | .141 | |
PL | Sig. (2-tailed) | .000 | .003 | .867 | .405 | .843 | .000 | .137 | |
N | 112 | 112 | 112 | 112 | 112 | 112 | 112 | 112 | |
Pearson Correlation | .198* | .129 | .016 | 1 | .109 | .002 | .026 | .065 | |
THUE | Sig. (2-tailed) | .037 | .175 | .867 | .251 | .981 | .784 | .493 | |
N | 112 | 112 | 112 | 112 | 112 | 112 | 112 | 112 | |
Pearson Correlation | .218* | .065 | .080 | .109 | 1 | .113 | -.027 | .154 | |
LOGROE | Sig. (2-tailed) | .021 | .497 | .405 | .251 | .233 | .774 | .104 | |
N | 112 | 112 | 112 | 112 | 112 | 112 | 112 | 112 | |
Pearson Correlation | .208* | .115 | -.019 | .002 | .113 | 1 | .007 | .150 | |
LOGSIZE | Sig. (2-tailed) | .028 | .225 | .843 | .981 | .233 | .942 | .114 | |
N | 112 | 112 | 112 | 112 | 112 | 112 | 112 | 112 | |
Pearson Correlation | .423** | .246** | .409** | .026 | -.027 | .007 | 1 | .125 | |
NQT | Sig. (2-tailed) | .000 | .009 | .000 | .784 | .774 | .942 | .191 | |
N | 112 | 112 | 112 | 112 | 112 | 112 | 112 | 112 | |
thoi gian | Pearson Correlation | .210* | .003 | .141 | .065 | .154 | .150 | .125 | 1 |
hoat dong ma hoa lai | Sig. (2-tailed) | .026 | .973 | .137 | .493 | .104 | .114 | .191 | |
N | 112 | 112 | 112 | 112 | 112 | 112 | 112 | 112 |
**. Correlation is significant at the 0.01 level (2-tailed).
*. Correlation is significant at the 0.05 level (2-tailed).
PHỤ LỤC 8: PHÂN TÍCH MÔ HÌNH HỒI QUY
Model Summaryb
R | R Square | Adjusted R Square | Std. Error of the Estimate | Durbin- Watson | |
1 | .741a | .549 | .524 | 1.525 | 1.716 |
a. Predictors: (Constant), NQT, LOGSIZE, THUE, LOGROE, KT, PL
b. Dependent Variable: CL
ANOVAa
Sum of Squares | df | Mean Square | F | Sig. | ||
Regressio n | 297.795 | 6 | 49.632 | 21.341 | .000b | |
1 | Residual | 244.196 | 105 | 2.326 | ||
Total | 541.991 | 111 |
a. Dependent Variable: CL
b. Predictors: (Constant), NQT, LOGSIZE, THUE, LOGROE, KT, PL
Coefficientsa
Unstandardized Coefficients | Standardized Coefficients | t | Sig. | Collinearity | Statistics | |||
B | Std. Error | Beta | Tolerance | VIF | ||||
(Constant) | -10.936 | 4.000 | -2.734 | .007 | ||||
KT | .415 | .100 | .291 | 4.153 | .000 | .872 | 1.147 | |
PL | .481 | .086 | .411 | 5.577 | .000 | .789 | 1.267 | |
1 | THUE | .193 | .096 | .133 | 2.008 | .047 | .972 | 1.029 |
LOGROE | 1.476 | .715 | .138 | 2.063 | .042 | .963 | 1.038 | |
LOGSIZE | 2.078 | .837 | .165 | 2.483 | .015 | .971 | 1.030 | |
NQT | .227 | .091 | .182 | 2.498 | .014 | .809 | 1.236 |
a. Dependent Variable: CL