In terms of products and services, savings and term deposits are used the most by customers (94.9%), followed by payment deposits (63.7%), ATM cards (42). .3%), Ebanking service (40.6%), domestic money transfer service (26.9%), international money transfer service (12%), bill payment service ( 11.1%), the remaining services that customers do not use or use insignificantly. In general, customers have not used SCB’s products and services to the maximum (see Table 2.1).
Regarding the preliminary assessment of the quality of each service, savings deposit, time deposit and payment deposit are rated as good as average, domestic, international money transfer and international payment services , e-banking services Ebanking and ATM cards are rated at average as quite good, the remaining services are at normal level (see table 2.1).
Table 2.1: Information and preliminary assessment of products and services used
| Products/services | Frequency | Rate (%) | Scores medium price jar |
| Money savings deposit, term deposit | 222 | 94.9% | 4.00 |
| Money send payment | 149 | 63.7% | 3.74 |
| Give get a loan | 28 | 12.0% | 2.14 |
| Deliver currency-gold translation | 0 | 0.0% | 0 |
| Play carry out valuable papers | 0 | 0.0% | 0 |
| Pandemic domestic money transfer | 63 | 26.9% | 3.19 |
| Pandemic international money transfer service | 28 | 12.0% | 3.07 |
| Pandemic bill payment service | 26 | 11.1% | 2.12 |
| Pandemic treasury service | 7 | 3.0% | 2.43 |
| Head private | 0 | 0.0% | 0 |
| Bag pay | 0 | 0.0% | 0 |
| Tell receive | 3 | 1.3% | 2.00 |
| Bar international math | ten | 4.3% | 3.40 |
| Card ATM | 99 | 42.3% | 2.64 |
| Pandemic e-banking service EBANKING | 95 | 40.6% | 3.15 |
| Is different | 6 | 2.6% | 2.50 |
| total | 736 | 314.5% |
Maybe you are interested!
-
 The Role Of Customer Satisfaction In The Development Of The Bank
 -
 Overview Of Saigon Commercial Joint Stock Bank After The Consolidation
 -
 Assess The Current Status Of Customer Satisfaction About Products And Services Of Saigon Commercial Joint Stock Bank
 -
 Evaluation Of Customer Satisfaction With Service Quality At Saigon Commercial Joint Stock Bank After Consolidation
 -
 Solution Group To Improve Customer Satisfaction
 -
 Evaluation of customer satisfaction for service quality at Saigon Commercial Joint Stock Bank after consolidation - 10
(Source: Appendix 5)
· About the evaluation of the scale of service quality components before and after the consolidation
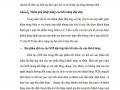
Reliability component: customers rate 6 scales of this component at a fairly good level, with an average score of about 3 both before and after the consolidation. The TC3 and TC4 scales after the merger were rated lower than before the merger. However, this reduction is not significant, so in general, the Trust component after the consolidation is still rated higher by customers than before the consolidation. This shows that SCB has built the trust of customers by being the first bank to consolidate (see chart 2.15).
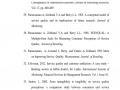
Component Responsive: customers rated from the DU7 to DU9 scale after the merger at a fairly good level, which is higher than that of the pre-merger. Particularly, the DU9 scale from the DU10 to DU15 scale after the consolidation all decreased slightly compared to before the consolidation but still at an average score of 4, which is a good level. In general, the Response component after the merger is still rated higher by customers than before the merger. This shows that the response of SCB has increased but not high, but still at a good level (see chart 2.16).
Figure 2.15: Average Trust Score
Figure 2.16: Average Score Response
(Source: Appendix 6)
Component of Service Capacity: Customers rate the 6 pre-consolidation scales from pretty good to good. After the consolidation, the rating of these 6 scales is higher but still at a level from pretty good to good. In which the NL16 scale increased the most. In general, SCB’s good service capacity has increased after the consolidation (see chart 2.17).
Empathy component: customers rate the 6 pre-merger and post-merger scales from pretty good to good. The post-consolidation rating is higher than the pre-merger rating minus the slightly decreasing DC24 scale (see chart 2.18).
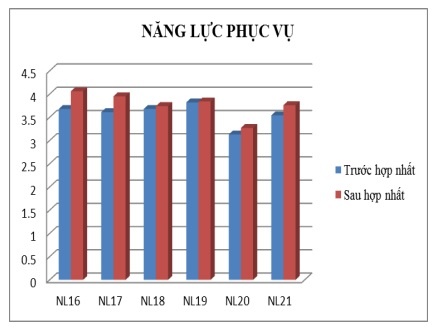
Figure 2.17: Average score Service capacity
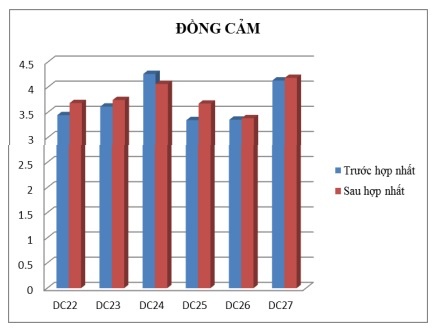
Figure 2.18: Average Score of Empathy
(Source: Appendix 6)
Components of Tangibles: 7 scales are rated from pretty good to good both before and after the consolidation. The PT29 and PT30 scales decreased slightly after the consolidation. All other factors increase.
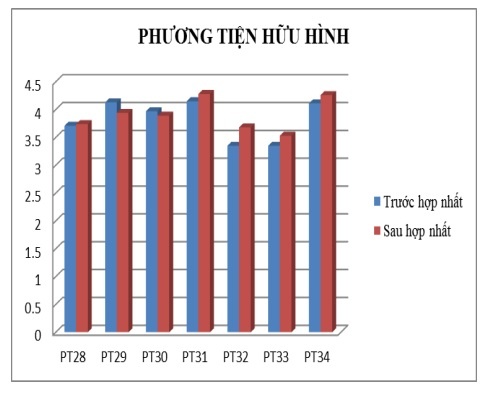
Figure 2.19: Average Score of Tangibles
(Source: Appendix 6)
In summary, the service quality assessment results of SCB increased markedly across all five service quality components with corresponding increases for the mean values of the components Reliability (0,11), Response ( 0.03), Service Capacity (0.19), Empathy (0.10), Tangible Means (0.08). This shows that SCB’s service quality is better evaluated after consolidation. Besides, there are still a few points that SCB needs to pay attention to improve (Trust: TC3, TC4; Response: DU11, DU12, DU13, DU14, DU15; Empathy: DC24; Tangible media: PT29, PT30) .
2.9.5.2. Check the scale
Analysis of Cronbach alpha coefficient to check the reliability of the scale
Scale of service quality components
Reliability component: includes 6 observed variables with excellent internal reliability (Cronbach alpha is 0.941>0.90).
Response component: includes 9 observed variables with excellent internal reliability (Cronbach alpha is 0.934>0.90).
Component Service capacity: includes 6 observed variables with excellent internal reliability (Cronbach alpha is 0.925>0.90).
Empathy component: includes 6 observed variables with excellent internal reliability (Cronbach alpha is 0.949>0.90).
Component Tangible means: includes 7 observed variables with excellent internal reliability (Cronbach alpha is 0.955>0.90).
Table 2.2: Cronbach’s alpha coefficient of service quality components
| Number | Components | Number of Scales | Cronbach’s alpha | Correlation coefficient scale – total smallest body |
| 1 | Trust | 6 | 0.941 | 0.797 |
| 2 | Response | 9 | 0.934 | 0.564 |
| 3 | Service capabilities | 6 | 0.925 | 0.488 |
| 4 | Empathetic | 6 | 0.949 | 0.710 |
| 5 | Tangible Media | 7 | 0.955 | 0.569 |
(Source: Appendix 7)
The variable correlation coefficients – the sum of the variables measuring this component are all greater than 0.40. This proves that the measurement variables in the components of Reliability, Responsiveness, Service Capability, Empathy and Tangible Means have meaningful contributions => Conclusion: the scale is reliable to measure. Measure research concepts Reliability, Responsiveness, Service Capability, Empathy and Tangible Means.
Customer satisfaction scale
The Customer Satisfaction Scale consists of 5 observed variables, which are Demand Satisfaction, Choice Priority, Transaction Commitment, Service Referral, and Satisfaction Level. The Customer Satisfaction scale has excellent internal reliability (Cronbach alpha is 0.947>0.90). The variable correlation coefficients – the sum of the variables that measure this component are all greater than 0.40. This proves that the 5 measured variables in the Customer Satisfaction component have meaningful contributions => Conclusion: the scale is reliable to measure the research concept of Customer Satisfaction.
Table 2.3: Cronbach alpha coefficient of customer satisfaction
| Observed variables | Correlation coefficient scale – total can |
| Customer Satisfaction row: Cronbach alpha = 0.947 | |
| Satisfy the need | 0.900 |
| Priority selection | 0.856 |
| Commit to Transaction | 0.894 |
| Service Introduction | 0.897 |
| Satisfaction level | 0.831 |
(Source: Appendix 7)
General conclusion: The results of the Cronbach Alpha reliability analysis for 6 scales (Reliability, Responsiveness, Service Competency, Empathy, Tangible Means and Customer Satisfaction) all reach the reliability of the scale. at an excellent level. This proves that the scales for measuring research concepts are reliable and that the data collected through these scales achieves internal reliability for in-depth analysis.
EFA . exploratory factor analysis
Scale of service quality components
Factor analysis for 34 observed variables of 5 service quality components: Reliability, Responsiveness, Service Capacity, Empathy, Tangible Means.
– First analysis: KMO coefficient = 0.894, satisfying the condition >=0.5, so the data is suitable for EFA factor analysis. Bartlett’s Test has statistical significance (Sig. < 0.05), so the observed variables are correlated with each other in the population.
After rotating the factors, out of 34 variables in the factor rotation matrix table, there are 3 variables with the largest loading coefficient <0.5 that do not meet the requirements. Six variables were removed after 7 times of EFA factor analysis as follows: PT33S, NL20S, DU15S, DU14S, DC25S and DC27S.
Variables that violate one of the following conditions:
– Convergence of variables (maximum load factor <0.5): PT33S, NL20S, DU15S, DU14S, DC25S
– Unidirectional, multi-factor load (distance between maximum load factor and 2nd largest load factor < 0.30): DC27S
– The 7th analysis: KMO coefficient = 0.873 meets the condition >= 0.5, so the data is suitable for EFA factor analysis. Bartlett’s Test has statistical significance (Sig. < 0.05), so the observed variables are correlated with each other in the population.
Conclusion: 5 research concepts are valid and discriminatory for subsequent multivariate regression analysis.
Table 2.4: Table of results after 7 times of factor analysis
| Analysis factor (Time) | KMO coefficient | Factors extract okay | Variance extract (>50%) | Rejected variable |
| 1 | 0.894 | 6 | 78.37 | PT33S |
| 2 | 0.890 | 6 | 79.30 | NL20S |
| 3 | 0.886 | 6 | 80.27 | DU15S |
| 4 | 0.891 | 5 | 77.59 | DU14S |
| 5 | 0.885 | 5 | 77.55 | DC25S |
| 6 | 0.879 | 5 | 78.09 | DC27S |
| 7 | 0.873 | 5 | 77.99 |
(Source: Appendix 8)
Customer satisfaction scale
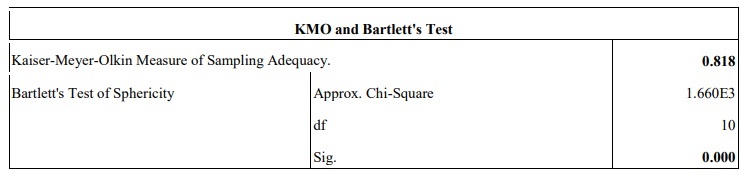
The coefficient KMO=0.818 satisfies the condition >=0.5, so the data ensures enough samples for factor analysis.
Bartlett’s Test has statistical significance Sig = 0.000, satisfying the condition < 0.05, so the observed variables are correlated with each other in the population.
Table 2.5: KMO test of satisfaction scale
(Source: Appendix 8)
Load coefficient of 5 observed variables on the factor Satisfaction meets convergence criteria (>0.50).
The results of EFA factor analysis for the dependent variable (Satisfaction) show that: the Satisfaction scale achieves convergence (validity) to measure the research concept.
Table 2.6: Factor analysis of the satisfaction scale
| Factor Matrix | |
| Factor | |
| first | |
| Satisfy the need | 0.919 |
| Prioritize selection choose | 0.864 |
| Commit to Transaction | 0.931 |
| Service Introduction | 0.934 |
| Satisfaction level | 0.852 |
Extraction Method: Principal Axis Factoring
a. 1 factors extracted. 6 iterations required.
(Source: Appendix 8)
2.9.5.3. Correction of research models and hypotheses
The research model and assumptions have not changed compared to the theoretical model and initial assumptions (see Figure 2.2).
2.9.5.4. Test the research model by multiple regression analysis
Analysis of the relationship between service quality components
Consider the correlation matrix between the dependent variable Satisfaction and 5 independent variables Trust, Responsiveness, Service Capacity, Empathy, Tangible Means. The variable Satisfaction (see Appendix 9) has a very close linear correlation with all 5 independent variables with r (correlation coefficient – Pearson Correlation) > 0.3 and statistically significant at the significance level. sig < 0.01. In other words, the satisfaction of the service quality components is positively correlated with the customer’s satisfaction with the bank. Therefore, the independent variables all ensure the inclusion conditions in the regression analysis model.
Multiple regression analysis
The multiple regression equation showing the relationship between factors and customer satisfaction has the following form:
Y = βo + β1X1 + β2X2 + β3X3 + β4X4 + β5X5
Inside:
– Y: the dependent variable represents the predictive value of customer satisfaction.
– βo, β1, β2, β3, β4, β5: regression coefficients.
– X1, X2, X3, X4, X5: independent variables in order: Reliability, Responsiveness, Service Capacity, Empathy, Tangible Means.
Table 2.7: Anova analysis in multiple linear regression
Model Summaryb
| Model (Model) | CHEAP | R Square (R Square) | Adjusted R2 (Adjusted R Square) | Standard Error (Std. Error of the Estimate) |
| first | .847a | .717 | .711 | .52696042 |
a. Predictors: (Constant), DONG CAM, DAP UNG, NANG LUC PHUC VU, TIN CAY, PHUONG TIEN HUU HINH
b. Dependent Variable: SU THOA MAN KHACH HANG
ANOVAb
| Model (Model) | Sum of squares (Sum of Squares) | DF | Average value square of squares (Mean Square) | F | Observational significance (Sig.) |
| 1 Regr essio n Resid ual Total | 160.521 63,313 223.834 | 5 228 233 | 32.104 .278 | 115.613 | .000a |
a. Predictors: (Constant), DONG CAM, DAP UNG, NANG LUC PHUC VU, TIN CAY, PHUONG TIEN HUU HINH
b. Dependent Variable: SU THOA MAN KHACH HANG
(Source: Appendix 9)
The analysis results show that the F-statistic is calculated from the R2 value of the model with very small statistical significance (sig. = 0.000a), showing that the multiple linear regression model is suitable for the data set. available and usable. Also, adjusted R2 = 0.711, which means that the model explains 71.1% of the variation in the data, in other words: 71.1% of the variation in satisfaction is explained by 5 independent factors.
Table 2.8: Statistical parameters of each variable in the equation
Parameters (Coefficientsa)
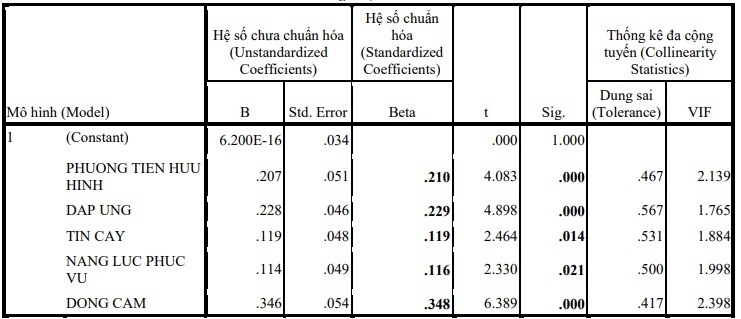
a. Dependent Variable: SU THOA MAN KHACH HANG
(Source: Appendix 9)
Regression coefficients with positive signs show that the factors in the above regression model have a proportional influence on customer satisfaction, that is, have a positive relationship with customer satisfaction.
The linear regression equation extracted by Beta coefficient has the following standard form:
Satisfaction = 0.119 * Trust + 0.229 * Responsiveness + 0.116 * Service capacity + 0.348 * Empathy + 0.210 * Tangible means (*)
The results show that all 5 factors of service quality have a positive and statistically significant impact on Customer Satisfaction (all Sig.<0.05) respectively as follows: Empathy has The strongest impact level (0.348), followed by Responsiveness (0.229), followed by Tangible Means (0.210), Reliability (0.119), and finally Service Capacity (0.116).
Test the model’s assumptions
The regression equation (*) shows the relationship between the components in the new banking service quality scale, customer satisfaction. On that basis, we have 5 tested hypotheses as follows:
Table 2.9: Hypothesis testing of the model
| Fake set | Content | degreeH ng regression coefficient | (<0.05) Sig. | kiss t t e t t t t |
| H1 | Trusted component has correlation positive with customer satisfaction goods. | 0.119 | 0.014 | Accept favorable |
| H2 | Responsive component yes correlation positive with customer satisfaction goods. | 0.229 | 0.000 | Accept favorable |
| H3 | Ability Components served with positively correlated with satisfaction of the customer. | 0.116 | 0.021 | Accept favorable |
| H4 | Empathy component has similar positively related to satisfaction of customer. | 0.348 | 0.000 | Accept favorable |
| H5 | Media element tangible positively correlated with satisfaction customer satisfaction. | 0.210 | 0.000 | Accept favorable |
(Nguồn: Phụ lục 9)
Statistical hypothesis testing results: the hypotheses H1, H2, H3, H4, H5 are accepted. That is, Trust, Responsiveness, Service Capability, Empathy and Tangible Means increase, the customer satisfaction increases.
Test the difference in rating scores between individual customers and corporate customers (see Appendix 10)