The pace of development of Vietnam's banking system and financial market is relatively fast, thereby significantly improving its financial depth. However, growth in quantity is not equivalent to growth in quality. The number of banks is large, but the size of most Vietnamese commercial banks is smaller than the average size banks in the region.
3.1.2 Scale of total assets increased quite quickly
The proportion of the respective assets of the blocks/total assets of the system is: State-owned commercial banks 44.1%, Joint-stock commercial banks: 42.6%, joint-venture banks, foreign banks 10.7%, the rest is of other credit institutions. Equity capital and charter capital of the system in 2014 increased at a low rate, respectively, the absolute numbers were 469.5 trillion VND, 435.6 trillion VND and the respective growth rates were 4.3%. and 3.2%. Own capital and charter capital of joint stock commercial banks account for 40.9% and 43.8%/data of the whole industry, respectively.
Table 3.1: Statistics of some basic indicators (As of December 31, 2014, the growth rate compared to the end of the preceding year)
Unit: billion VND, %
| Type of credit institution | Total assets have | Equity capital | Authorized capital | ROA | ROE | Minimum capital adequacy ratio | Ratio of short-term capital for medium and long- term loans | Ratio of credit extension to mobilized capital (TT1) | |||
| Absolute number | Growth | Absolute number | Growth | Absolute number | Growth | ||||||
| (first) | (2) | (3) | (4) | (5) | (6) | (7) | (8) | (9) | (ten) | (11) | (twelfth) |
| State Commercial Banks | 2,876,174 | 14.82 | 169,696 | 1.87 | 134.206 | 4.77 | 0.53 | 6.92 | 9.40 | 25.02 | 94.61 |
| Joint Stock Commercial Bank | 2,780,976 | 13.10 | 203.154 | 5.71 | 191.115 | 1.10 | 0.40 | 4.64 | 12.07 | 21.35 | 75.36 |
| Joint Venture Bank, foreign | 701.986 | -0.42 | 106,004 | 5.76 | 86.625 | 6.25 | 0.61 | 3.79 | 30.78 | -4.45 | 57.36 |
| Finance and leasing companies | 68,673 | 4.94 | 15.208 | 4.71 | 18,873 | 0.28 | 2.33 | 8.25 | 29.33 | 4.90 | 220.76 |
Cooperative credit institutions | 87,090 | 20.69 | 2.510 | 8.39 | 4.831 | 12.94 | 0.93 | 10.67 | 29.91 | 11.51 | 99.25 |
| The whole system | 6,514,900 | 12.20 | 496,573 | 4.36 | 435.649 | 3.29 | 0.51 | 5.49 | 12.75 | 20.15 | 83.67 |
Maybe you are interested!
-

 Research on the impact of loan portfolios on profitability of joint stock commercial banks - 2
 -
 Classification According To Loan Collateral
 -
 Regression Model Of Benjamin M. Tabak, Dimas M.fazio And Daniel O.cajueiro (2010)
 -
 Impact Of Loan Portfolio On The Risk Of Joint Stock Commercial Bank
 -
 Research on the impact of loan portfolios on profitability of joint stock commercial banks - 7
 -
 Existence - The Level Of Diversification On The Portfolio Is Not High, Most Banks Mainly Lend To About 3-4 Similar Industries.
Source: State Bank
The minimum capital adequacy ratio of Vietnamese banks is quite high compared to regulations, reaching 12.7%.
This rate is the highest of the joint-venture and foreign banks at 30.7%. The ratio of short-term capital for medium and long-term loans of the whole system is 20.1%. State-owned commercial banks have the highest rate of 25%. The ratio of credit extension to mobilized capital (TT1) of the whole industry is low (83.67%) compared to many years ago, but the state-owned commercial banks still stand at 94.6%.
3.1.3 Growth in money supply, credit and inflation
- Period 2006-2010: credit growth is fast and hot, always maintained at over 20%.
In the period 2006 to 2010 Vietnam's economy continued to grow at a high rate, the average GDP during this period was 7.23% (in which the period from 2006 to 2007 increased by over 8% annually, the years from 2008 to 2010, falling below 7%). This is also the period when the growth rate of credit activities, capital mobilization growth and total payment means of the banking system are often high above 20%. According to calculations from the State Bank of Vietnam, credit to the economy in this period increased on average 33.2%/year, higher than the average growth rate of 26.1%/year in the 2001-2005 period. and credit/GDP ratio increased from 0.71 times in 2006 to 1.16 times in 2010.
In general, all the achieved figures are much higher than the targets expected by the State Bank in the project of developing the banking industry up to 2010 approved by the Government. This is not necessarily a good sign, because it has a significant impact on the abnormal development of the economy during this period.
Graph 3.1. Growth in money supply, credit and inflation
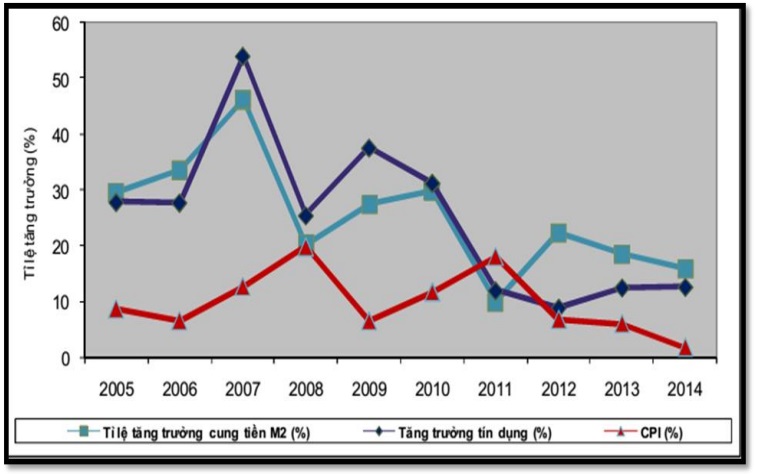
Source: Gold Star Capital (2014)
Besides, the relationship between economic growth and credit growth during this period (especially after 2007) shows signs of the phenomenon of "countercyclical" ie credit growth ". hot” while the economy is in decline. Average credit growth during this period was 4.47 times higher than GDP growth. Experience in Vietnam in the period 2000 - 2004 is considered stable with an average economic growth of 7.18%, inflation fluctuates at less than 4%, this time, the credit growth rate of the whole system banking is always below 30%, only about 3- 3.85 times higher than GDP growth.
According to economic experts, if credit growth is within 2-3 times GDP growth rate, it is considered not to be detrimental to the economy. In Vietnam, this limit has been exceeded, so an asset bubble appeared in the economy when the hot credit capital mainly poured into risky fields such as real estate or securities business.
In fact, in the period 2007-2010, credit grew strongly, many banks gave loans massively, lacked risk control, leading to the inability to recover debts and huge loss of capital. During this period, although on average, the growth of mobilized capital was almost equal to the growth of credit (34.63% compared to 34.3%), but there were times in 2007, 2008 and 2009 when raising capital in Vietnam. lower level than credit, making the banking system always in a state of liquidity shortage, especially small commercial joint stock banks that have to race with interest rates to mobilize capital.
The rapid and hot development of commercial banks, with many potential risks from the perspective of the whole system and the whole economy, forced the Government and the State Bank to have strong interventions at the macro level. . The remarkable point in this period is that the SBV had to simultaneously apply both direct (through administrative orders) and indirect (through economic) measures to influence the financial and monetary market in order to achieve the goal of controlling inflation, stabilizing interest rates and exchange rates.
Typically, in 2007, in order to control the hot growth of the real estate market, the State Bank issued Directive No. 03/2007/CT-NHNN dated May 28, 2007 to ensure the outstanding loan balance ratio for investment loans. securities trading does not exceed 3% in terms of controlling size, credit quality and lending for securities investment and trading in order to control inflation and promote economic growth. Accordingly, in the period 2007-2009, the lack of liquidity caused the outstanding loans in this period to decrease sharply. Therefore, the State Bank has applied a stimulus package through the Government's interest rate support program.
The SBV guides credit institutions to lend by issuing Circular No. 02/2009/TT-NHNN dated February 3, 2009, Circular No. 05/2009/TT-NHNN dated April 7, 2009, Circular No. 09/ 2009/TT-NHNN dated 05/05/2009 to create conditions for many businesses to access loans to meet the needs of production and business development. Besides, by 2010, inflationary pressure increased causing instability in the economy. The banking system is difficult to mobilize capital, but the positive point is that deposit growth is still higher than credit growth. Interest rates remain at a very high level, hindering business operations because Circular 13 stipulates that banks must increase the minimum capital adequacy ratio (CAR) from 8% to 9%, and at the same time raise the capital adequacy ratio (CAR) to 9%. The risk of real estate and securities investment loans increased by 250%.
Also according to this circular, banks are only allowed to use a maximum of 80% of their mobilized capital for lending. Between 2006 and 2010, banks tended to lend to focus on the real estate and market sectors. stock market, outstanding loans in these two areas grew "hot". This leads to potential portfolio risk, high risk of bank default. This is the period when Vietnam's banking system has had very strong changes in line with the trend of integration into the international economy. Associated with the ups and downs of the economy during this period, banking activities have contributed to promoting economic development, credit growth is always associated with an increase in GDP of the economy. In addition, inadequacies in banking activities are also factors that negatively affect the stability of the economy during this time.
- Period 2011-2014: the banking system has excess liquidity, credit growth slows down and stays below 15% With the overheated growth of outstanding loans in the 2006-2010 period, especially the Massive lending by banks to the real estate sector and the stock market without control over the quality of loans has resulted in high bad debt situation. NPLs increase rapidly, especially real estate credits and credit provision is overly concentrated on a group of economic groups, including the private sector, increasing credit risk and inefficiency. efficiency in allocating financial resources. The commercial banking system from the fourth quarter of 2011 was in danger of chain breakdown due to the loss of liquidity of a group of weak commercial banks. In 2012, the banking system had excess liquidity,but a very large part of enterprises still lack serious investment capital because they cannot (due to bad debts), or difficult to access loans (due to too high interest rates), even, or because they do not want to borrow (due to not being able to borrow money). products, large inventories). This congestion is threatening the survival of businesses and the banking system - the two main forces of the market economy. A number of businesses could not access capital, on the other hand, high backlog inventory pushed many businesses to the state of bankruptcy and closed.A number of businesses could not access capital, on the other hand, high backlog inventory pushed many businesses to the state of bankruptcy and closed.A number of businesses could not access capital, on the other hand, high backlog inventory pushed many businesses to the state of bankruptcy and closed.
As of December 22, 2014, the total means of payment increased by approximately 15.99% compared to the end of 2013, the growth of outstanding loans reached 12.62%, and the growth of deposit outstanding loans increased by 15.76%. Thus, credit balance returned to an upward trend in 2013 and 2014. The positive thing is that credit has flowed more into the direct manufacturing sector instead of into speculative sectors that are easy to create. bubble like in previous years. Compared to the end of 2013, credit for small and medium enterprises as of the end of November 2014 increased by 13.8%; credit for high-tech sector increased by 14.8%; credit for agriculture and rural development increased by 12.8% (Bao Viet Securities Company, 2014).
The period 2011-2014, is the period to focus on stabilizing the economy, controlling inflation, focusing on solving the liquidity of the real estate market, because once the liquidity of the real estate market has not improved, , the handling of bad debts of commercial banks will also be difficult. In addition, this period is the period of restructuring the banking system through the merger (M&A) of underperforming banks.
3.1.4 Improved competitiveness and provision of banking services to better meet the needs of the economy
The banking technology and management system is gradually being renewed according to international practices and standards. Banking services are no longer limited to only capital mobilization and credit extension services, but also many modern banking services have been deployed and increasingly popular such as payment cards, banking services. electronics, foreign currency trading, investment banking, etc. The extensive banking network throughout the country has created favorable conditions for people and businesses to access banking services. Besides distribution channels in the form of physical presence such as transaction points, branches and transaction offices, electronic distribution channels are also developing rapidly. 3.1.5 Strengthening market opening and international integration in the banking sector
Vietnam's banking services market has been significantly liberalized, with a relatively high degree of openness and a high degree of foreign bank penetration. Vietnamese banks have gradually entered the international and regional financial markets. Up to now, most of the world's major banks have had a commercial presence in Vietnam and some Vietnamese banks have had a presence abroad (Laos, Cambodia, Myanmar, China, Germany).
3.2 Current status of loan portfolio at Vietnam Joint Stock Commercial Banks
To analyze the impact of the loan portfolio on the bank's profitability , the thesis analyzes the current status of the loan portfolio of Vietnamese joint stock commercial banks.
Currently in Vietnam, the loan portfolio of commercial banks can be divided according to criteria such as economic sector; according to the loan term; According to customers... In addition to the above main criteria, each bank also has criteria for classification by geographical area, by currency... The following section will focus on analyzing the structure of the loan portfolio. according to the above criteria, especially emphasizing criteria by economic sector.
3.2.1 Structure of loan portfolio by economic sector
Decision No. 16/2007/QD-NHNN dated April 18, 2007 of the State Bank promulgating the financial reporting regime for credit institutions, in which the criteria for classifying outstanding loans by industry are based on system of economic sectors (according to decision 10/2007/QD-TTg dated 23/01/2007). In this document, the list of economic sectors is divided by the General Statistics Office into 21 level 1 industry codes.
The structure of loan portfolio by economic sector of joint stock commercial banks in Vietnam is presented in Appendix 1,2,3. In general, most banks extend loans to all occupations. This shows that banks have a diversified loan portfolio in many fields and industries, and there is no specialization focusing on lending in one field or industry. Outstanding loans in all industries have grown steadily over the years. The reason is due to the development and growth of the economy, the world economic integration has created favorable conditions for banks to develop their lending activities according to the needs of the market. However, the structure of the loan portfolio at all banks is still only diversified in lending in a few industries, the diversification of the portfolio is still limited.The industries where joint stock commercial banks often focus on lending are mainly commerce, manufacturing and processing, and personal services to the community.
This portfolio structure is relatively consistent with the macroeconomic structure: focusing on industrial and commercial development and gradually reducing the proportion of agriculture, forestry and fishery. Currently, most banks pay attention to the growth of outstanding loans in the field of community personal services, which always account for half of the total outstanding loans. Individuals in the community are potential customers, so banks all want to target the personal loan market, and many banks focus their capital to develop this form of lending. Specifically, Table 3.2,3.3,3.4 is a table showing the proportion of outstanding loans of the three banking sectors: commerce, manufacturing and processing, and community personal services.
Table 3.2: Proportion of outstanding loans to 3 industries of commerce, manufacturing and processing, and personal services of large-scale banks
Unit: %
| Bank | 2004 | 2005 | 2006 | 2007 | 2008 | 2009 | 2010 | 2011 | 2012 | two thousand and thirteen | 2014 |
| CTG | 54.78% | 66.73% | 64.10% | 68.32% | 68.12% | 66.17% | 74.41% | 71.75% | 76.71% | 78.31% | 76.67% |
| VCB | 73.71% | 65.23% | 66.13% | 72.30% | 73.35% | 75.87% | 72.45% | 73.25% | 72.10% | 76.52% | 75.38% |
| BIDV | 0.00% | 0.00% | 59.37% | 56.19% | 58.24% | 57.05% | 56.31% | 69.20% | 57.29% | 56.12% | 52.43% |
| STB | 0.00% | 0.00% | 68.36% | 68.25% | 65.00% | 61.22% | 55.54% | 59.94% | 48.16% | 39.03% | 35.58% |
| MBB | 0.00% | 0.00% | 0.00% | 72.61% | 66.77% | 65.22% | 70.98% | 66.36% | 68.78% | 68.15% | 70.86% |
| TECHCOMBA NK | 0.00% | 0.00% | 40.03% | 0.00% | 0.00% | 38.41% | 16.49% | 0.00% | 84.64% | 69.79% | 67.04% |
| EIB | 0.00% | 0.00% | 72.93% | 80.32% | 66.36% | 61.08% | 80.02% | 75.07% | 75.63% | 75.66% | 75.15% |
| SCB | 0.00% | 0.00% | 81.41% | 76.99% | 75.46% | 70.71% | 63.12% | 0.00% | 13.03% | 15.04% | 36.10% |
| ACB | 88.70% | 82.42% | 91.66% | 89.36% | 87.27% | 86.66% | 85.63% | 84.95% | 87.69% | 87.05% | 87.28% |
| SHB | 0.00% | 0.00% | 0.00% | 41.45% | 29.75% | 26.26% | 39.15% | 49.94% | 43.65% | 41.97% | 37.01% |
Source: Author's own calculation
Table 3.3: Proportion of outstanding loans to 3 industries of commerce, manufacturing and processing, and personal services of the group of medium-sized banks
Unit: %
Bank 2004 2005 2006 2007 2008 2009 2010 2011 2012 2013 2014
| MSB 0.00% 0.00% 47.84% 50.28% 0.00% 0.00% 51.05% 51.26% 41.21% 32.05% 0.00% |
HDBANK 0.00% 0.00% 0.00% 0.00% 66.87% 64.77% 16.92% 17.97% 13.08% 59.11% 48.50%
| East Asia 0.00% 0.00% 80.24% 78.77% 66.53% 69.76% 67.91% 60.54% 57.11% 37.74% 0.00% |
ABBANK 0.00% 47.16% 61.89% 90.19% 0.00% 0.00% 0.00% 0.00% 39.03% 29.68% 28.78%
Source: Author's own calculation
Table 3.4: Proportion of outstanding loans to 3 industries of commerce, manufacturing and processing, and personal services of small-sized banks
| OCEAN 0.00% 0.00% 0.00% 22.29% 12.23% 21.89% 18.04% 41.39% 34.02% 27.88% 0.00% |
| MDB 0.00% 0.00% 0.00% 0.00% 57.70% 74.18% 26.07% 16.93% 26.77% 25.79% 17.30% |
| VIETA 0.00% 0.00% 0.00% 0.00% 20.76% 34.31% 35.62% 0.00% 13.91% 21.88% 0.00% |
Unit: %
| Bank | 2004 | 2005 | 2006 | 2007 | 2008 | 2009 | 2010 | 2011 | 2012 | two thousand and thirteen | 2014 |
| PNB | 0.00% | 0.00% | 0.00% | 30.95% | 66.19% | 56.54% | 66.01% | 74.49% | 72.66% | 69.31% | 0.00% |
| OCB | 0.00% | 0.00% | 82.09% | 72.40% | 69.10% | 28.69% | 60.98% | 56.15% | 0.00% | 0.00% | 0.00% |
| MHB | 0.00% | 0.00% | 35.30% | 53.38% | 56.35% | 57.04% | 53.75% | 54.26% | 59.24% | 21.00% | 0.00% |
| PGBANK | 0.00% | 0.00% | 0.00% | 0.00% | 0.00% | 31.00% | 0.00% | 55.12% | 54.19% | 61.07% | 55.85% |
| VIETCAPITAL | 0.00% | 0.00% | 0.00% | 89.53% | 82.14% | 0.00% | 31.07% | 33.76% | 0.00% | 0.00% | 0.00% |
| BAOVIET | 0.00% | 0.00% | 0.00% | 0.00% | 0.00% | 58.89% | 48.30% | 24.57% | 36.80% | 0.00% | 0.00% |
| KIENLONG 0.00% 0.00% 0.00% 0.00% 65.07% 73.73% 53.85% 51.74% 58.57% 59.17% 62.88% |
| SOUTH Asia 0.00% 0.00% 0.00% 0.00% 0.00% 0.00% 61.60% 62.30% 31.42% 26.25% 28.98% |
| SGBANK 0.00% 0.00% 0.00% 0.00% 35.65% 55.84% 0.00% 0.00% 36.80% 32.51% 30.81% |
Source: Author's own calculation
3.2.2 Structure of loan portfolio by term (Appendix 4)
Analyzing the structure of the loan portfolio by term, we see that in almost all commercial banks regardless of their size, the proportion of short-term loans accounts for a high proportion of the total outstanding loans, about 50%- 70% of the total outstanding balance. In terms of risk, it is clear that medium and long-term loans are more risky than short-term loans due to market fluctuations over a longer period of time. As for medium and long-term loans, liquidity will be less than short-term loans. At the same time, the theoretical interest rate will also be higher than the short term due to less sensitive interest rates. So banks prefer short-term loans. However, in the current period, banks have begun to tend to gradually reduce short-term loans to increase the proportion of medium and long-term loans. This is good news,Banks have begun to know how to allocate their loans, and pay more attention to financing their production and business activities because loans for investment or production projects often have a long term. Besides, there are also many banks looking for ways to extend debt, reverse debt, shift short-term debt to medium and long-term debt in order to prolong the payment term because creditors cannot pay on time, so the ratio Bank's bad debt also decreased significantly.As a result, the bad debt ratio of the bank also decreased significantly.As a result, the bad debt ratio of the bank also decreased significantly.
One point worth noting, if banks focus too much on long-term debts, it will affect their liquidity because the debts are not yet due for collection while the money mobilized from the population is also mainly mobilized with short term. Therefore, banks need to have a good strategy in allocating loan capital in a reasonable way between the three terms to limit risks and achieve expected profits.
The growth rate of term loans in 2007 increased sharply due to the increase in lending to ensure that the outstanding loan balance for securities business investment does not exceed 3%. Besides, the increase in real estate investment loans has increased the balance of medium and long-term loans. The growth rate in 2008 was associated with three influencing factors: joint stock commercial banks actively restructured credit balance to ensure a balance between capital sources and capital use, the regulation of the State Bank limited growth. Credit and economic difficulties, the demand for loans decreased, especially in the fields of real estate investment and securities business, slowing the growth rate of loans compared to 2007.
In 2009, the growth rate of term loans increased sharply due to the driving factors from positive changes in the economy, the effect of the stimulus package through the interest rate support program (4%/year). ) of the Government and the State Bank of Vietnam to maintain low interest rates, enabling customers to access more loans. The growth rate of medium- and long-term loans was higher than that of short-term loans in 2010, due to continued lending for investment projects under the Government's stimulus program and expansion of loans for implementation. investment projects under economic restructuring programs.
In 2011, the State Bank of Vietnam implemented a tight monetary policy, continued to limit lending to non-manufacturing sectors, and due to the impact of high interest rates and high non-performing loans, increasing the growth rate of all types of loans. slow borrowing. By 2012, the State Bank had gradually eased lending activities in line with the evolution of banking activities and credit growth capacity of credit institutions. lending activities to a number of areas, creating favorable conditions for loans to grow this year.
3.2.3 Structure of loan portfolio by customer type
The diversification on the portfolio is not only reflected in the industry, term, debt group but also according to the criteria of customers/ownership properties. Realizing that most commercial joint stock banks focus on lending to individuals and joint stock companies, limited companies and private individuals. The proportion of capital for these types of entities accounts for almost 80-90% of the total outstanding loans, while the proportion of loans to SOEs is very low (for example, at ACB, SACOMBANK, EXIMBANK, the ratio of loans to SOEs enterprises is very low. tends to decrease gradually and does not exceed 5% of total outstanding loans at the end of 2010). However, the general assessment of such a customer-specific portfolio structure is reasonable, in line with the target market of joint-stock commercial banks and the development trend of the multi-sector economy in Vietnam.
In addition to the main criteria such as by industry, by investment field, by term, by customer... analyzed above, there are also a number of criteria that commercial banks can use to classify the portfolio. their loans such as classification by geographical area, currency, type of loan, etc. However, these criteria are not mandatory (such as criteria by industry, by term) so many commercial joint stock banks are not fair. loan portfolio according to these criteria.
To summarize, by analyzing the current status of loan portfolios of some joint stock commercial banks in the period from 2004 to 2014, it was found that:
- The level of diversification on the loan portfolio of most banks is generally not high. Regardless of the criteria of economic sector, investment field, target customer, or loan term... usually, the loan portfolio of joint-stock commercial banks only focuses on one or two certain types of loans (many of which are specific). least 4 types as in the loan portfolio by economic sector). In terms of concentration, the type of loan that accounts for the highest proportion in the portfolio can be up to over 60% of the total loan balance of the portfolio, and at the same time many times the bank's equity (the maximum is 4 times). in the industry category).