- The loan portfolio of joint-stock commercial banks shows signs of potentially large concentrations of risk. These risks will turn into serious financial losses for banks once the economy turns unfavorable. This has been proven through the actual performance of Vietnamese banks in the following years.
3.3 Profits of joint stock commercial banks in Vietnam
- Income structure is not diversified, mainly depends on lending activities Contribution to operating income of Vietnam's banking industry is still mainly from traditional banking operations: capital mobilization and lending , and this segment is represented by net interest income which contributes from 70% to 90% of a bank's total operating income, depending on the bank's strategy. The share of net interest and non-interest income in banks operating in developed financial markets is typically about the same, and net interest income may dominate. for example: 60%: 40%), as these markets have developed, the demand for financial services is diversified, no longer primitive, just stopping at lending and raising capital like the financial market. main Vietnam. In these developed financial markets,Banking operations are very diverse, including advanced operations such as asset management, investment banking, card services of all kinds, etc. Due to the characteristics of the Vietnamese banking market, we only focus The emphasis on net interest income contributes to a bank's operating income structure in this segment, its growth profile.
The table of operating income from interest and non-interest operating income is shown in Appendix 5
Table 3.5: Income from lending activities by weight
Unit: %
| 2004 | 2005 | 2006 | 2007 | 2008 | 2009 | 2010 | 2011 | 2012 | two thousand and thirteen | 2014 | |
| ABB | 89.97% | 62.66% | 76.95% | 80.41% | 82.28% | 82.28% | 89.93% | 101.87% | 95.34% | 78.84% | 88.11% |
| ACB | 49.72% | 126.93% | 112.74% | 43.40% | 64.35% | 56.75% | 75.85% | 86.41% | 117.76% | 77.64% | 78.69% |
| BAOVIET | 0.00% | 0.00% | 0.00% | 0.00% | 0.00% | 99.02% | 80.76% | 84.09% | 92.49% | 0.00% | 0.00% |
| BIDV | 81.06% | 84.56% | 58.24% | 69.47% | 88.05% | 68.69% | 80.01% | 81.99% | 79.19% | 72.62% | 76.89% |
| CTG | 163.20% | 86.30% | 77.55% | 80.56% | 82.69% | 81.99% | 81.58% | 89.60% | 83.87% | 83.90% | 83.59% |
| EAST ASIA | 180.93% | 93.97% | 93.59% | 60.14% | 59.62% | 66.53% | 71.21% | 86.64% | 89.62% | 87.87% | 68.41% |
| HDBank | 169.03% | 154.08% | 84.10% | 76.61% | 53.26% | 47.64% | 73.52% | 104.98% | 55.84% | 19.95% | 56.20% |
| EIB | 65.39% | 60.35% | 59.58% | 67.34% | 69.75% | 76.66% | 78.56% | 85.03% | 90.98% | 84.22% | 92.10% |
| KIENLONG | 0.00% | 90.61% | 73.71% | 92.23% | 92.37% | 95.50% | 105.25% | 95.86% | 97.27% | 97.27% | 99.03% |
| LIENVIET | 0.00% | 0.00% | 0.00% | 0.00% | 73.54% | 95.50% | 105.25% | 97.94% | 106.17% | 106.16% | 108.42% |
| MBB | 81.73% | 79.97% | 76.60% | 74.39% | 102.73% | 69.27% | 86.08% | 101.46% | 84.50% | 79.95% | 78.73% |
| MDB | 0.00% | 185.55% | 100.75% | 99.63% | 106.93% | 96.15% | 98.80% | 102.70% | 101.86% | 108.95% | 113.75% |
| MHB | 86.71% | 85.07% | 46.51% | 91.95% | 78.91% | 81.31% | 92.25% | 92.09% | 97.98% | 93.51% | 100.16 % |
Maybe you are interested!
-

 Classification According To Loan Collateral
 -
 Regression Model Of Benjamin M. Tabak, Dimas M.fazio And Daniel O.cajueiro (2010)
 -
 Improved Competitiveness And Provision Of Banking Services To Better Meet The Needs Of The Economy
 -
 Research on the impact of loan portfolios on profitability of joint stock commercial banks - 7
 -
 Existence - The Level Of Diversification On The Portfolio Is Not High, Most Banks Mainly Lend To About 3-4 Similar Industries.
 -
 Traditional Concentrations Of The Hirshmann-Herfindahl Index (Hhi):
| MSB | 0.00% | 100.0% | 100.0% | 81.16% | 90.46% | 76.32% | 74.41% | 64.56% | 76.73% | 66.81% | 50.21% |
| NAMAs | 155.41% | 100.0% | 84.14% | 76.50% | 70.01% | 92.07% | 65.65% | 80.62% | 70.24% | 59.31% | 87.04% |
| OCB | 155.41% | 100.0% | 84.14% | 76.50% | 70.01% | 92.07% | 65.65% | 80.62% | 70.24% | 59.31% | 87.04% |
| OCEAN | 0.00% | 0.00% | 100.0% | 40.96% | 40.96% | 82.48% | 103.53% | 102.94% | 110.05% | 96.51% | 0.00% |
| PGBANK | 0.00% | 100.0% | 0.00% | 86.61% | 66.07% | 68.15% | 77.79% | 93.72% | 84.64% | 76.53% | 87.44% |
| PNB | 77.87% | 82.45% | 61.21% | 61.21% | 50.99% | 54.24% | 29.24% | 14.53% | -21.87% | 23.33% | 0.00% |
| SAIGONBANK | 68.04% | 82.89% | 90.51% | 88.45% | 72.96% | 87.66% | 47.28% | 91.18% | 91.91% | 89.66% | 85.12% |
| SCB | 391.03% | 221.65% | 84.16% | 64.10% | 82.93% | 78.08% | 30.39% | 0.00% | 96.53% | 77.58% | 64.98% |
| SHB | 0.00% | 0.00% | 89.50% | 34.10% | 33.66% | 74.82% | 81.83% | 85.15% | 63.81% | 88.85% | 83.69% |
| STB | 93.26% | 72.92% | 64.03% | 47.18% | 46.73% | 56.22% | 76.95% | 86.49% | 94.80% | 87.19% | 79.58% |
| TECHCOMBANK | 96.42% | 95.10% | 89.08% | 89.50% | 60.93% | 63.80% | 67.48% | 79.53% | 88.79% | 76.77% | 81.23% |
| VCB | 66.69% | 77.25% | 73.55% | 71.14% | 67.26% | 69.98% | 71.07% | 83.53% | 72.55% | 69.53% | 68.04% |
| VIETNAM | 141.09% | 85.32% | 58.59% | 56.22% | 69.90% | 63.48% | 72.74% | 75.84% | 59.07% | 103.86% | 94.91% |
| VIETCAPITAL | 0.00% | 182.53% | 38.53% | 44.56% | 158.49% | 82.80% | 94.31% | 72.93% | 70.30% | 80.22% | 70.48% |
| VPBank | 0.00% | 88.45% | 99.69% | 70.64% | 93.17% | 83.98% | 82.30% | 81.31% | 94.69% | 80.23% | 84.37% |
Source: Financial statements of banks
The business efficiency of the banking system in general tends to decrease over the years. Industry size increases, accompanied by a very high level of ROE of the whole industry, the industry average is above 10 %, in both bad conditions of the economy, and recession of the industry by economy, and if you look at the average of a cycle from 2008 - 2014, the average ROE of the banking industry is at 15.42% , as shown in the following table Table 3.6: Return on Equity ROE
Unit: %
| 2004 | 2005 | 2006 | 2007 | 2008 | 2009 | 2010 | 2011 | 2012 | two thousand and thirteen | 2014 | |
| ABB | 0.00% | 8.75% | 8.44% | 8.82% | 1.54% | 7.38% | 10.85% | 6.55% | 8.30% | 2.64% | 2.04% |
| ACB | 33.39% | 30.09% | 34.43% | 44.49% | 31.53% | 24.63% | 21.74% | 27.49% | 7.64% | 6.38% | 6.58% |
| BAOVIET | 0.00% | 0.00% | 0.00% | 0.00% | 0.00% | 4.04% | 8.25% | 6.96% | 3.78% | 0.00% | 0.00% |
| BIDV | 10.44% | 8.81% | 15.20% | 15.90% | 15.77% | 18.12% | 17.97% | 13.16% | 12.90% | 15.27% | 13.84% |
| CTG | 6.50% | 8.54% | 11.33% | 14.12% | 15.70% | 13.48% | 22.21% | 26.83% | 19.87% | 13.25% | 10.50% |
| EAST ASIA | 15.04% | 16.20% | 13.62% | 13.99% | 15.98% | 15.23% | 13.71% | 16.86% | 0.00% | 5.47% | 9.69% |
| EIB | 0.00% | 3.09% | 18.58% | 11.25% | 7.43% | 8.65% | 13.51% | 20.39% | 13.32% | 4.32% | 0.39% |
| HDBank | 13.05% | 12.69% | 12.66% | 16.75% | 4.97% | 11.20% | 12.97% | 14.44% | 7.30% | 3.11% | 5.71% |
| KIENLONG | 0.00% | 22.59% | 9.99% | 11.26% | 4.42% | 8.47% | 9.00% | 11.81% | 10.17% | 9.06% | 5.14% |
| LIENVIET | 0.00% | 0.00% | 0.00% | 0.00% | 12.87% | 14.85% | 17.21% | 18.26% | 12.42% | 7.72% | 6.36% |
| MB | 17.53% | 19.50% | 22.63% | 20.62% | 17.62% | 20.75% | 22.13% | 20.68% | 20.62% | 16.32% | 15.79% |
| MDB | 0.00% | 22.73% | 17.69% | 15.92% | 11.75% | 12.34% | 6.68% | 9.89% | 2.93% | 1.60% | 2.63% |
| MHB | 4.31% | 6.39% | 8.33% | 14.04% | 4.75% | 4.96% | 3.70% | 2.62% | 9.44% | 3.04% | 0.00% |
| MSB | 0.00% | 13.27% | 15.20% | 16.86% | 12.90% | 28.48% | 23.42% | 10.08% | 2.44% | 3.57% | 1.51% |
| NAMAs | 17.99% | 5.34% | 6.48% | 11.87% | 0.99% | 4.29% | 7.89% | 9.03% | 5.62% | 4.13% | 5.68% |
| OCB | 17.99% | 20.47% | 22.83% | 13.55% | 4.01% | 10.51% | 11.13% | 8.79% | 6.07% | 6.20% | 5.53% |
| OCEAN | 0.00% | 0.00% | 5.23% | 7.20% | 4.20% | 13.65% | 16.42% | 11.18% | 5.33% | 4.27% | 0.00% |
| PGBANK | 0.00% | 0.00% | 0.00% | 7.53% | 8.35% | 16.51% | 13.40% | 18.73% | 8.30% | 1.19% | 4.00% |
| PNB | 18.55% | 14.07% | 13.34% | 8.79% | 5.15% | 9.33% | 12.87% | 5.94% | 2.88% | 0.41% | 0.00% |
| SGBANK | 15.55% | 14.74% | 15.47% | 14.43% | 11.12% | 12.34% | 29.12% | 8.90% | 8.69% | 4.91% | 5.18% |
| SCB | 18.69% | 18.69% | 21.54% | 14.91% | 16.93% | 8.51% | 5.98% | 0.00% | 0.56% | 0.35% | 0.69% |
| SHB | 0.00% | 0.00% | 1.38% | 9.44% | 8.76% | 13.60% | 14.98% | 15.04% | 22.00% | 8.56% | 7.59% |
| STB | 18.78% | 16.72% | 19.76% | 27.36% | 12.64% | 18.25% | 15.55% | 13.97% | 7.10% | 14.49% | 12.56% |
| TECHCOMBANK | 21.03% | 2.25% | 1.84% | 1.79% | 2.37% | 2.24% | 1.71% | 1.91% | 0.42% | 0.39% | 0.65% |
| VCB | 15.36% | 16.57% | 29.44% | 19.51% | 9.88% | 25.87% | 22.98% | 17.08% | 12.60% | 10.43% | 10.76% |
| VIETNAM | 13.38% | 11.54% | 9.91% | 14.07% | 5.22% | 13.31% | 10.43% | 7.12% | 4.62% | 1.69% | 1.31% |
| VIETCAPITAL | 0.00% | 7.14% | 7.42% | 13.07% | 0.55% | 5.06% | 3.55% | 10.04% | 6.22% | 3.18% | 4.96% |
| VPBank | 0.00% | 21.07% | 19.49% | 15.03% | 6.23% | 11.88% | 12.98% | 14.28% | 10.19% | 14.17% | 15.01% |
Source: Financial statements of banks
Table 3.7: Return on Total Assets ROA
Unit: %
| 2004 | 2005 | 2006 | 2007 | 2008 | 2009 | 2010 | 2011 | 2012 | two thousand and thirteen | 2014 | |
| ABB | 0.00% | 2.42% | 3.07% | 1.59% | 0.32% | 1.56% | 1.54% | 0.77% | 0.91% | 0.27% | 0.19% |
| ACB | 1.61% | 1.51% | 1.47% | 2.71% | 2.32% | 1.61% | 1.25% | 1.32% | 0.55% | 0.34% | 0.48% |
| BAOVIET | 0.00% | 0.00% | 0.00% | 0.00% | 0.00% | 0.87% | 1.26% | 0.86% | 0.69% | 0.00% | 0.00% |
| BIDV | 0.64% | 0.50% | 0.76% | 0.84% | 0.88% | 1.04% | 1.13% | 0.83% | 0.74% | 0.83% | 0.78% |
| CTG | 0.29% | 0.41% | 0.48% | 0.76% | 1.00% | 0.77% | 1.12% | 1.51% | 1.28% | 1.08% | 0.93% |
| EAST ASIA | 1.28% | 1.35% | 1.48% | 1.68% | 1.73% | 1.52% | 1.34% | 1.56% | 0.00% | 0.46% | 0.86% |
| EIB | 0.00% | 0.21% | 1.74% | 1.78% | 1.74% | 1.99% | 1.85% | 1.93% | 1.21% | 0.39% | 0.03% |
| HDBank | 1.59% | 1.93% | 2.15% | 1.36% | 0.51% | 1.35% | 1.01% | 1.07% | 0.67% | 0.31% | 0.51% |
| KIENLONG | 0.00% | 2.71% | 3.02% | 3.56% | 1.45% | 1.76% | 1.94% | 2.59% | 1.93% | 1.57% | 0.79% |
| LIENVIET | 0.00% | 0.00% | 0.00% | 0.00% | 5.95% | 4.35% | 2.61% | 2.14% | 1.42% | 0.78% | 0.52% |
| MB | 1.43% | 1.48% | 2.01% | 2.28% | 1.88% | 2.07% | 1.95% | 1.54% | 1.48% | 1.28% | 1.31% |
| MDB | 0.00% | 3.47% | 3.06% | 5.01% | 3.68% | 4.37% | 1.64% | 2.77% | 1.22% | 0.84% | 1.53% |
| MHB | 0.42% | 0.50% | 0.47% | 0.61% | 0.17% | 0.15% | 0.18% | 0.17% | 0.73% | 0.28% | 0.00% |
| MSB | 0.00% | 0.74% | 1.23% | 1.26% | 1.33% | 1.60% | 1.29% | 0.69% | 0.20% | 0.30% | 0.14% |
| NAMAs | 2.05% | 1.51% | 1.41% | 1.65% | 0.17% | 0.67% | 1.09% | 1.44% | 1.04% | 0.60% | 0.57% |
| OCB | 2.05% | 4.84% | 5.18% | 3.70% | 1.17% | 2.45% | 2.39% | 1.81% | 1.32% | 1.08% | 0.65% |
| OCEAN | 0.00% | 0.00% | 0.94% | 0.60% | 0.32% | 0.95% | 1.17% | 0.83% | 0.38% | 0.29% | 0.00% |
| PGBANK | 0.00% | 0.00% | 0.00% | 0.87% | 1.21% | 2.11% | 1.63% | 2.63% | 1.30% | 0.17% | 0.52% |
| PNB | 1.65% | 1.44% | 1.62% | 1.11% | 0.62% | 0.88% | 0.88% | 0.35% | 0.17% | 0.02% | 0.00% |
| SGBANK | 2.50% | 2.14% | 2.26% | 2.08% | 1.51% | 1.82% | 5.54% | 1.89% | 1.97% | 1.17% | 1.16% |
| SCB | 1.12% | 1.48% | 1.65% | 1.41% | 1.44% | 0.68% | 0.49% | 0.00% | 0.04% | 0.03% | 0.04% |
| SHB | 0.00% | 0.00% | 0.53% | 1.85% | 1.46% | 1.52% | 1.26% | 1.23% | 1.80% | 0.65% | 0.51% |
| STB | 1.71% | 1.92% | 2.40% | 3.13% | 1.44% | 1.94% | 1.49% | 1.36% | 0.68% | 1.42% | 1.26% |
| TECHCOMBANK | 1.16% | 2.25% | 1.84% | 1.79% | 2.37% | 2.24% | 1.71% | 1.91% | 0.42% | 0.39% | 0.65% |
| VCB | 0.92% | 1.01% | 1.89% | 1.32% | 0.64% | 1.65% | 1.53% | 1.25% | 1.13% | 0.99% | 0.88% |
| VIETNAM | 1.88% | 2.81% | 8.27% | 10.40% | 2.68% | 6.27% | 4.60% | 1.97% | 0.87% | 0.27% | 0.16% |
| VIETCAPITAL | 0.00% | 1.30% | 1.85% | 4.57% | 0.18% | 1.64% | 0.98% | 2.14% | 1.08% | 0.47% | 0.66% |
| VPBank | 0.00% | 1.09% | 1.40% | 1.61% | 0.78% | 1.27% | 1.15% | 1.12% | 0.69% | 0.91% | 0.88% |
Source: Financial statements of banks
In general, the ROA and ROE ratios of banks both increased sharply in the period 2008-2010, from the period 2011-2014 began to decrease gradually. In 2008, when the world economic crisis started, Vietnam's economy was also affected, inflation increased, interest rates of banks increased sharply. This situation has affected the psychology of people and businesses. Since the high deposit interest rate has attracted the amount of idle money in the society, the assets of the banks increased sharply while the equity remained unchanged. Besides, the market real estate marketis growing strongly, banks are focusing capital to promote real estate lending to increase profits. Profit increased, equity remained unchanged, so ROE of all banks increased sharply. ROA and ROE have started to decrease since 2011. Joint Stock Commercial Banks have the lowest average ROA and ROE ratios and fluctuate the most due to the weak business results of some small joint stock commercial banks.
While a gloomy atmosphere pervaded the entire banking industry in 2012, a few banks still performed well and grew profits higher, such as CTG, BIDV, VCB, and STB. Among them, STB's profit margin is the most impressive, with a net profit margin of 24.5%, nearly twice as high as that of the second-ranked bank in terms of profitability (MBB 13). .7%).
3.4 Impact of loan portfolio on the risk of Joint Stock Commercial Bank
To assess the concentration of risk on the portfolio, in addition to considering the degree of diversification, it is also possible to compare the proportion of outstanding loans in a certain industry in the total outstanding balance of the whole portfolio with the safety limits for permission. The content of Decision 457/QD-NHNN stipulates prudential ratios in the operations of credit institutions. In which the maximum limit of lending to a customer does not exceed 15% of the bank's own capital, the total loan and guarantee does not exceed 25% of the own capital. For a group of customers lending no more than 50% of their own capital; the total limit of loans and guarantees must not exceed 60% of equity capital. In addition, this decision also stipulates: for loans/guarantees (for one customer) with a value exceeding 5% of own capital, the bank must have a policy and monitoring method.If the loan and total loans to a customer exceed 10% of the bank's own capital, it must be approved by the Board of Directors/or an authorized person. This regulation shows that, when the proportion of loans exceeds 5% (especially over 10%) of a bank's own capital, it must be considered a concentrated risk and should be carefully monitored. To guide the implementation of banks, Decision 457/QD-NHNN has a clear description of the relevant customer group, which includes customer group with ownership relationship, customer group with management relationship, executive, member.Decision 457/QD-NHNN has a clear description of the relevant customer group, which includes a group of customers with ownership relationships, a group of customers with management, executive, and member relationships.Decision 457/QD-NHNN has a clear description of the relevant customer group, which includes a group of customers with ownership relationships, a group of customers with management, executive, and member relationships.
After Decision 457/QD-NHNN was issued on April 19, 2005, a number of other documents were issued by the State Bank such as: Directive 03/2007/CT-NHNN dated May 28, 2007 (effective) from January 2008); Decision 03/2008/QD-NHNN dated February 1, 2008, replacing Directive 03; Circular 13/2010/TT-NHNN dated May 20, 2010 (effective from October 1, 2010) replacing Decision 457; Circular No. 19/2010/TT-NHNN dated September 27, 2010 amending Circular 13 (effective from October 1, 2010). The above legal documents are the basis for commercial banks to concretize the lending limit policy of each bank.
Based on the above decisions, directives and circulars, it can be seen that the concentration of risk in the loan portfolio of joint stock commercial banks in Vietnam is quite high.
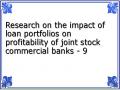
Typical examples through Figure 3.1
Figure 3.1: Structure of loan portfolio by industry
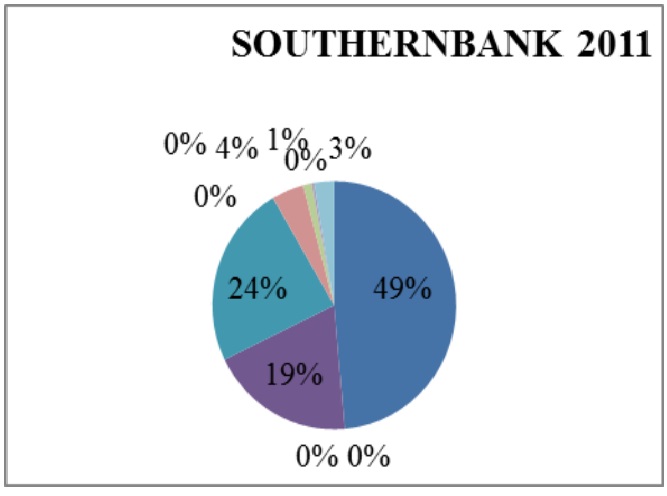
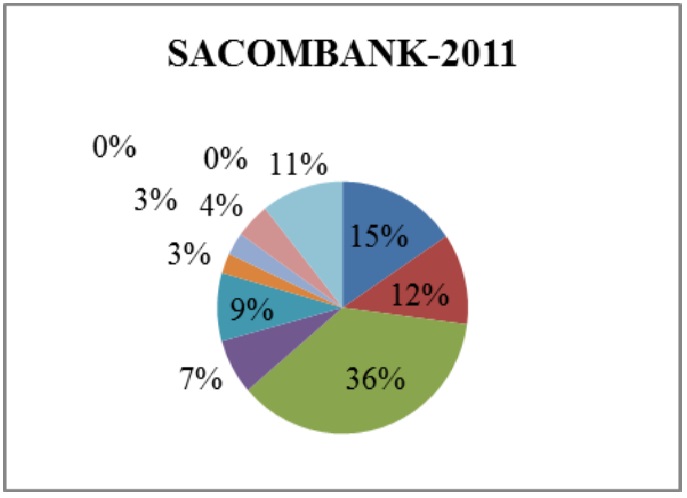
Source: Author's own calculation
Specifically, in Figure 3.1, it can be seen that in large-scale joint stock commercial banks such as ACB and Sacombank, the proportion of outstanding loans of the largest industry in the loan portfolio usually fluctuates at over 30-40% of total outstanding loans. In 2011, Sacombank had a ratio of 26% of outstanding loans for production and processing to total outstanding loans, while Phuong Nam Bank had the largest proportion of loans to the commercial sector, up to 49%. This is a manifestation of the high concentration of outstanding loans compared to the provisions in the above documents in Vietnam.