CHAPTER 4
RESEARCH OF FACTORS IMPACT ON THE DEVELOPMENT OF CARD SERVICES AT ASIAN JOINT STOCK COMMERCIAL BANK
Chapter 4, the author will give an overview of the quantitative research of the thesis, conduct surveys, collect and process data to identify factors affecting the development of card services at ACB. In addition, through data analysis to determine the influence of factors on the development of card services as a basis for proposing solutions in the next chapter.
4.1 Research model overview
4.1.1 Theoretical basis of research model
ACB's research model of factors affecting card development is built on the theoretical foundation mentioned above and the background of research related to card service development. The author will use the models in the following studies as a basis:
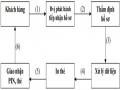
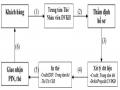
- Luong Thi Ngoc Lan (2011), "Development of payment card services at Vietnam Joint Stock Commercial Bank for Industry and Trade, Luu Xa - Thai Nguyen branch"
- Tran Thi Phuong Thao (2011), "Developing card services at Joint Stock Commercial Bank for Industry and Trade of Vietnam - Thua Thien Hue branch"
- Vu Van Thuc (2012), "Developing card services at Bank for Agriculture and Rural Development of Vietnam"
4.1.2 Proposed research model
From the use of research models as the basis, and at the same time, based on the analysis and assessment of experts in the field of bank cards, combined with the polling of experts, the brothers and sisters. Having experience in business, market development, customer care field, currently working at ACB, the author has combined a group of factors affecting the development of ACB's cards. The proposed research model is developed as follows:
- Combination of factors from research models
From the research of Luong Thi Ngoc Lan (2011), the author draws out 4 relevant factors including: legal, customer psychology, procedures, and technology infrastructure.
From the research of Tran Thi Phuong Thao (2011), after eliminating duplicate factors, the author has drawn 3 factors: brand, ATM/POS network and fees.
Similarly, from the research of Vu Van Thuc (2012), after removing the duplicate elements, the author draws out the element: utility.
Thus, the author has combined a group of 8 factors affecting ACB's card development: legal, customer psychology, procedures, technology infrastructure, brand, ATM network/ POS, fees and utilities.
- Analyze, evaluate, unify factors and propose research models
After analyzing, evaluating, discussing and filtering factors from experience and experts' opinions, From the initial 8 factors, the author considers and unifies the proposed research model of the study, there will be 6 remaining factors. Factors affecting the development of card services at ACB include: customer psychology, legality, technology infrastructure, brand, ATM/POS network, and utilities.
H1
H2 H3
H4 Brand
H5 ATM/POS Network
H6
Developing card services at ACB
Customer psychology
Juridical
Technology infrastructure
Utilities
Figure 4.1. Proposed research model
- The proposed research model includes 6 hypotheses as follows:
- Hypothesis H1: Customer psychology has a positive impact on the development of card services of ACB.
- Hypothesis H2: Legal has a positive impact on the development of card services of ACB.
- Hypothesis H3: Technology infrastructure has a positive impact on the development of card services of ACB.
- Hypothesis H4: Brand has a positive impact on the development of card services of ACB.
- Hypothesis H5: ATM/POS network has a positive impact on the development of card services of ACB.
- Hypothesis H6: Utility has a positive impact on the development of card services of ACB.
- Multiple linear regression model is represented with coded factors:
PTDVT = β 0 + β 1 *TL + β 2 *PL + β 3 *CN + β 4 *TH + β 5 *ML + β 6 *TI + i
- PTDVT: Card service development
- TL: Customer psychology
- PL: Legal
- CN: Technology infrastructure
- TH: Brand
- ML: ATM/POS network
- TI: Utilities
4.2 Research Methods
4.2.1 Preliminary Research
- β 0 : Coordinate of origin (intercept coefficient)
- i: Error
The author uses the method of interviewing people who are knowledgeable about the research problem. The author discusses with 15 experts in the field of banking cards in the positions of Directors, Heads of Departments, Team leaders, R&D specialists, product consultants, complaint settlement and care. customers,… The meeting
Group discussion was conducted with the above subjects in turn in 1 working day to develop a preliminary survey.
After using the expert method, from the initial 08 factors, the author agrees that there are 6 factors affecting the development of card services at ACB, including: customer psychology, legal, institutional technology infrastructure, brands, ATM/POS networks, utilities. Experts agree that fees and procedures should be eliminated due to:
Firstly, the fees related to the card are being waived by the bank or charge a small fee in the market;
Secondly, ACB's card issuance procedure is quick, for example ACB2GO card, customers will receive a card, PIN, instructions to activate use only 15 minutes after registering to use the card at customer service. (This is a very competitive advantage of ACB in the market).
There are 24 observed variables affecting the development of card services of ACB. The author uses a draft scale (Appendix 1) as a preliminary scale to conduct group discussions (Appendix 2) with 10 participants who are individuals who have professional knowledge, often use and interact with cards. including 01 individual customer relations specialist, 02 individual customer relations officers, 02 tellers, 03 personal customer service staff (counters), 02 customer service center consultants 24/7… as a basis to build an official scale for conducting interviews. After conducting group discussion, 6 independent factors and 24 observed variables of ACB's research model on card service development were kept unchanged and a questionnaire was made to conduct the survey. After collecting the appropriate number of samples,
4.2.2 Formal Research
- How to do it
The author builds a survey questionnaire and collects data through a direct survey of employees related to card services (because this is the audience who knows best about card operations) and divides Share the link to survey in Ho Chi Minh City, Hanoi on Google Drive tool.
The results obtained after ensuring a sufficient number of research samples, the author conducts to export to an Excel file and encode for data entry and processing on SPSS 20 software.
The content of the questionnaire is detailed in Appendix 4
- Sampling method and sample size
Samples were selected by convenience sampling method. According to Hoelter (1983): The minimum sample size is 200 research samples. According to Bollen (1989): The overall sample will be equal to the total number of observed variables multiplied by a factor of 5. In this study, there are 24 main observed variables, so the total sample is at least 120 observations. . However, in this study, the author wanted to limit the deviation of the data to be low, so he conducted a study of 350 samples. For the topic using exploratory factor analysis (EFA), the minimum sample size should be 50, preferably 100, and the observation/measurement variable ratio is 5:1 (Nguyen Dinh Tho, 2011). , page 415).
The topic uses two methods of EFA analysis and regression analysis, so the sample size is 350 enough to ensure EFA analysis and multiple linear regression analysis. The sample size above is taken more than the minimum to deduct the loss occurring during the survey.
- Methods of data collection and analysis
The questionnaire was sent via email (100), sent at the counter (100), met face-to-face with staff (150) with the support of the operations department. The list of participants who received the survey via email was selected on the ACB's database.
For the questionnaire placed at the counter, when the staff involved in the transaction at the counter can answer and send it back to the staff immediately.
Survey period: November - December 2015
- Data processing methods
After collecting research data, it will be processed on SPSS 20 software in the following order:
Step 1: Prepare data by collecting answer sheets, cleaning data, encoding necessary data in questionnaires with SPSS software.
Step 2: Conduct descriptive statistics of the collected data
Step 3: Assess the reliability of the scale using Cronbach's Alpha coefficient Step 4: Exploratory factor analysis EFA
Step 5: Regression analysis to determine the relationship between dependent and independent variables
4.3 Research results
4.3.1 Statistics on research sample
There were all 350 quantitative survey questionnaires sent, after collecting 216 valid votes, the rate was 61.71%.
Table 4.1 Number of survey questionnaires sent and received
Survey form | Send | Collected |
Field survey | 250 | 160 |
Survey via email | 100 | 56 |
Total | 350 | 216 |
Maybe you are interested!
-
 Developing card services at Asia Commercial Joint Stock Bank - 2
 -
 Developing card services at Asia Commercial Joint Stock Bank - 3
 -
 Developing card services at Asia Commercial Joint Stock Bank - 4
 -
 Developing card services at Asia Commercial Joint Stock Bank - 6
 -
 Developing card services at Asia Commercial Joint Stock Bank - 7
 -
 Developing card services at Asia Commercial Joint Stock Bank - 8

Source: Survey results, 2015
Table 4.2 Statistics of study sample
STT | Respondent Information | Quantity (person) | Ratio % |
first | Sex | ||
1.1 | male | 107 | 49.54 |
1.2 | Female | 109 | 50.46 |
total | 216 | 100 | |
2 | Age (age) | ||
2.1 | 18 to 30 | 97 | 44.9 |
2.2 | 31 to 40 | 78 | 36.1 |
2.3 | 41 to 45 | 17 | 7.9 |
2.4 | 46 to 50 | 15 | 6.9 |
2.5 | Over 50 | 9 | 4.2 |
total | 216 | 100 | |
3 | Work experience | ||
3.1 | Less than 1 year | 19 | 8.8 |
3.2 | From 01 year to less than 03 years | 59 | 27.3 |
3.3 | From 3 years to less than 5 years | 92 | 42.6 |
3.4 | Over 05 years | forty six | 21.3 |
total | 216 | 100 | |
4 | Working department | ||
4.1 | Card business | 60 | 27.8 |
4.2 | Customer Service – Transaction Counter | 85 | 39.4 |
4.3 | Standard spending/cardholder operations | 38 | 17.6 |
4.4 | Other | 33 | 15.3 |
total | 216 | 100 | |
Source: Survey results, 2015
- Gender: Based on the statistics in Table 4.5, the surveyed subjects were 216, in which the rate of female was 50.46%, male was 49.54%.
- Age: The surveyed age range from 18 years old to over 50 years old, of which the age group from 18 to 30 years old accounted for the majority (97 people), accounting for 44.9%, the age group from 31 years old to under 40 years old had the highest percentage. rate 36.1%, age from 41 to under 50 has rate 14.8%. Over 50 years old and above account for a smaller proportion of about 4.2%.
- Working experience: Of the 216 surveyed people, 92 people using ACB's card services are those with working experience from 03 years to less than 05 years, accounting for the majority of the survey sample, about 42.6 %; 59 people have from 01 year to less than 03 years of experience, accounting for 27.3%; 46 people with more than 5 years of experience accounted for (21.3%), lastly less than 1 year, 19 people accounted for 8.8%.
- Working department: Focusing mainly on the working group at Customer Service Department – Transaction counter has 85 people (39.4%), followed by card business with 60 people (27.8%). . There were 38 people (17.8%) in the group of subjects performing the payment approval/cardholder operation, and the last group had 33 people (15.3%).
- The majority of employees use ACB's debit card, with 133 people, accounting for 61.6%; followed by prepaid cards, with 53 people, accounting for 24.5%, and finally credit cards with 30 people, accounting for 13.9%.
Table 4.3 Types of ACB's employee cards mainly used
card type | Frequency | Percent (%) |
Credit | 30 | 13.9 |
Debit card | 133 | 61.6 |
Prepaid cards | 53 | 24.5 |
Total | 216 | 100.0 |
Source: Survey results, 2015
4.3.2 Analysis of the reliability of the scale
The scales all have Cronbach Alpha coefficient > 0.6, showing that the scales meet the standards as good scales with high reliability. All observed variables have satisfactory correlation of total variables > 0.3. So the research scales in the work are eligible for EFA analysis.
All scales have reliability > 0.6. All remaining 27 observed variables will be used in the EFA exploratory factor analysis step. So the research model keeps the 27 variables that meet the requirements for the quality of the scale and the number of retained variables for EFA analysis is 27 variables. After analyzing the Cronbach's Alpha reliability coefficient, the scales were next evaluated by the exploratory factor analysis method (EFA).
Table 4.4 Cronbach's alpha factors affecting card service development
Encode | Average if variable type | Variance if variable type | Total variable correlation | Cronbach's alpha if variable type |
Customer Psychology Scale: Cronbach's Alpha = 0.719 | ||||
TL1 | 10.3472 | 5.223 | ,494 | ,665 |
TL2 | 10.3611 | 5.106 | ,548 | ,633 |
TL3 | 10.1389 | 5.255 | ,446 | ,696 |
TL4 | 10.1389 | 5.181 | ,545 | ,636 |
Legal Scale: Cronbach's Alpha = 0.707 | ||||
PL1 | 6.9120 | 2.564 | ,518 | ,625 |
PL2 | 6.9722 | 2,632 | ,555 | ,580 |
PL3 | 6.9398 | 2.671 | ,501 | ,644 |
Scale of Technology Infrastructure: Cronbach's Alpha = 0.725 | ||||
CN1 | 9.6065 | 6.575 | ,513 | ,665 |
CN2 | 9,5509 | 6146 | ,590 | ,619 |
CN3 | 9,7176 | 6.576 | ,465 | ,694 |
CN4 | 9.5556 | 6.602 | ,493 | ,677 |
Brand Scale: Cronbach's Alpha = 0.728 | ||||
TH1 | 10.7870 | 4,996 | ,593 | ,621 |
TH2 | 10.5694 | 5,260 | ,512 | ,671 |
TH3 | 10,8102 | 5.122 | ,558 | ,643 |
TH4 | 10,7500 | 5.919 | ,412 | ,725 |
ATM/POS Network Scale: Cronbach's Alpha = 0.783 | ||||
ML1 | 10.9352 | 5.698 | ,606 | ,722 |
ML2 | 10.9676 | 5.566 | ,571 | ,740 |
ML3 | 10,8889 | 6.313 | ,542 | ,754 |
ML4 | 10.9167 | 5.258 | ,645 | ,700 |
Utility Scale: Cronbach's Alpha = 0.776 | ||||
TI1 | 13.9815 | 7,739 | ,546 | ,737 |
TI2 | 14.1389 | 7,916 | ,600 | ,719 |
TI3 | 14.1759 | 8,481 | ,459 | ,765 |
TI4 | 13.6991 | 7,979 | ,522 | ,745 |
TI5 | 13.8565 | 7,956 | ,633 | ,709 |
Card Service Development Scale: Cronbach's Alpha = 0.774 | ||||
PTDVT1 | 6.2917 | 3.063 | 0.581 | 0.744 |
PTDVT2 | 6.5463 | 1.868 | 0.644 | 0.696 |
PTDVT3 | 6.2731 | 2,534 | 0.669 | 0.635 |
Source: Author of survey and calculation of SPSS, 2015
4.3.3 Exploratory Factor Analysis (EFA)
- EFA test results of factors affecting card service development
Because the scales when testing Cronbach Alpha give good results, only a few variables of the scales are excluded, so the entire scale in the study is eligible for EFA processing to ensure the reliability of the scale.
Conditions for factor analysis that the author requires are:
- KMO coefficient ≥ 0.5 significance level of Barlett test ≤ 0.05.
- Factor loading factor > 0.5, if the variable has load factor < 0.5, it will be eliminated.
- The scale is accepted when the total variance extracted is ≥ 50%.
- Eigenvalues coefficient > 1.
- Differentiate the factor loading factor of an observed variable between the factors ≥ 0.3 to create a discriminant value between the factors.
Table 4.5 KMO coefficients and Bartlett . test
KMO and Bartlett's Test | ||
Kaiser-Meyer-Olkin Measure of Sampling Adequacy | 0.698 | |
Bartlett's Test of Sphericity | Approx. Chi-Square | 1,396,072 |
DF | 276 | |
sig, | 0.000 | |
Source: Survey results, SPSS, 2015
The above analysis conditions provide enough conditions for EFA processing to ensure reliability.
- KMO value reached 0.698 > 0.6, so factor analysis is appropriate with the obtained research data.
- Bartlett test has a value of 1396,072 with significance level Sig= 0.00<0.05, so the observed variables used are linearly correlated with representative factors (reject hypothesis H0: observed variables do not have a linear correlation with each other in the population), so the hypothesis of the factor model is not appropriate and will be rejected, which proves that the data used for factor analysis is completely consistent. consistent with research.
- There are 6 factors extracted at Eigenvalues = 1,489 > 1, so it can be confirmed that the number of factors extracted is appropriate.
The total variance explained of the factor analysis is 58,225 > 50%. This means that 58.225 % of the variation of the factors is explained by the observed variables
Table 4.6 Total Variance Explained
Components | Initial Eigenvalues | Extraction Sums of Squared Loadings | ||||
Total | % of Variance | Cumulative % | Total | % of Variance | Cumulative % | |
first | 3.257 | 13,570 | 13,570 | 3.257 | 13,570 | 13,570 |
2 | 2,691 | 11.214 | 24.783 | 2,691 | 11.214 | 24.783 |
3 | 2,321 | 9,670 | 34.454 | 2,321 | 9,670 | 34.454 |
4 | 2,281 | 9,502 | 43,956 | 2,281 | 9,502 | 43,956 |
5 | 1,935 | 8,065 | 52.020 | 1,935 | 8,065 | 52.020 |
6 | 1.489 | 6,205 | 58,225 | 1.489 | 6,205 | 58,225 |
7 | ,936 | 3,902 | 62,127 | |||
8 | ,830 | 3.458 | 65,585 | |||
9 | ,775 | 3.228 | 68,813 | |||
ten | ,742 | 3.092 | 71,905 | |||
11 | ,715 | 2,980 | 74.886 | |||
twelfth | ,709 | 2.955 | 77.840 | |||
13 | ,660 | 2.752 | 80.592 | |||
14 | ,607 | 2.531 | 83,123 | |||
15 | ,538 | 2.241 | 85,364 | |||
16 | ,514 | 2.141 | 87.505 | |||
17 | ,475 | 1,978 | 89,483 | |||
18 | ,436 | 1.818 | 91,302 | |||
19 | ,413 | 1,721 | 93,023 | |||
20 | ,396 | 1,650 | 94.673 | |||
21 | ,369 | 1.536 | 96,209 | |||
22 | ,332 | 1.384 | 97,593 | |||
23 | ,324 | 1.351 | 98,944 | |||
24 | ,253 | 1.056 | 100,000 yen |
Source: Survey results, SPSS, 2015
The factor analysis results show that the scale of factors affecting the development of card services at ACB has 6 factors with 24 observed variables shown in the result table of the factor rotation matrix.
Table 4.7 Factor rotation matrix results
Components | ||||||
first | 2 | 3 | 4 | 5 | 6 | |
TI5 | ,782 | |||||
TI2 | ,758 | |||||
TI1 | ,712 | |||||
TI4 | ,689 | |||||
TI3 | ,661 | |||||
ML4 | ,817 | |||||
ML1 | ,782 | |||||
ML2 | ,768 | |||||
ML3 | ,702 | |||||
TL2 | ,812 | |||||
TL4 | ,780 | |||||
TL1 | ,729 | |||||
TL3 | ,620 | |||||
TH1 | ,770 | |||||
TH3 | ,766 | |||||
TH2 | ,719 | |||||
TH4 | ,639 | |||||
CN2 | ,794 | |||||
CN1 | ,747 | |||||
CN4 | ,705 | |||||
CN3 | ,679 | |||||
PL1 | ,803 | |||||
PL2 | ,778 | |||||
PL3 | ,777 | |||||
Rotation Method: Varimax with Kaiser Normalization. | ||||||
Source: Survey results, SPSS, 2015
- Separation of the "card service development" factor
The author conducts factor separation test for dependent factors through the method of loading factor score test. The author finds that the observed variables are strongly correlated and solve for the same problem. The total coefficient of model explanation reached 70.364% and only 1 group of factors.
Table 4.8 Total Variance Explained
Compo -nent | Initial Eigenvalues | Extraction Sums of Squared Loadings | ||||
Total | % of Variance | Cumu -lative % | Total | % of Variance | Cumu -lative % | |
first | 2.111 | 70,364 | 70,364 | 2.111 | 70,364 | 70,364 |
2 | ,506 | 16,869 | 87.232 | |||
3 | ,383 | 12,768 | 100,000 yen | |||
Extraction Method: Principal Component Analysis. | ||||||
Source: Survey results, SPSS, 2015
4.3.4 Correlation analysis results between independent and dependent variables. (With two-tailed test with 95% confidence)
Table 4.9 Correlation Matrix Table
Correlations | ||||||||
TL | PL | CN | th | ML | TIEN | PTDVT | ||
TL | Pearson Correlation | first | ||||||
Sig. (2-tailed) | ||||||||
WOMEN | ,216 | |||||||
PL | Pearson Correlation | ,098 | first | |||||
Sig. (2-tailed) | ,151 | |||||||
WOMEN | 216 | 216 | ||||||
CN | Pearson Correlation | ,269 ** | ,055 | first | ||||
Sig. (2-tailed) | , 000 | ,422 | ||||||
WOMEN | 216 | 216 | 216 | |||||
th | Pearson Correlation | ,174 * | ,046 | ,387 ** | first | |||
Sig. (2-tailed) | ,011 | ,505 | , 000 | |||||
WOMEN | 216 | 216 | 216 | 216 | 216 | |||
ML | Pearson Correlation | ,294 ** | ,120 | ,234 ** | ,350 ** | first | ||
Sig. (2-tailed) | , 000 | ,077 | ,001 | , 000 | ||||
WOMEN | 216 | 216 | 216 | 216 | 216 | |||
TIEN | Pearson Correlation | ,363 ** | ,090 | ,266 ** | ,214 ** | ,326 ** | first | |
Sig. (2-tailed) | , 000 | ,186 | , 000 | ,002 | , 000 | |||
WOMEN | 216 | 216 | 216 | 216 | 216 | 216 | ||
PTDVT | Pearson Correlation | ,423 ** | ,189 ** | ,555 ** | ,576 ** | ,536 ** | ,503 ** | first |
Sig. (2-tailed) | , 000 | ,005 | , 000 | , 000 | , 000 | , 000 | ||
WOMEN | 216 | 216 | 216 | 216 | 216 | 216 | 216 | |
**. Correlation is significant at the 0.01 level (2-tailed). | ||||||||
*. Correlation is significant at the 0.05 level (2-tailed). | ||||||||
Source: Survey results, SPSS, 2015
Looking at the correlation matrix, we can see that the card service development scale (PTDVT) is significantly correlated with the independent factors in the model. The correlation coefficient between the dependent factors and the independent factors has the Sig value ≤ 0.05, so it can be concluded that there is no multicollinearity in the model. But to ensure the accuracy of the model, the author still tests the correlation regression model.
4.3.5 Linear regression analysis results
Table 4.10 Model Summary b
Model | CHEAP | CHEAP Square | Adjusted R Square | Std. Error of the Estimate | Durbin-Watson |
first | ,806 a | ,650 | ,639 | ,17778 | 1,913 |
a. Predictors: (Constant), customer sentiment, legal, technology infrastructure, brands , ATM/ POS networks, utilities. | |||||
b. Dependent Variable: Develop card services. | |||||
Source: Survey results, SPSS, 2015
The adjusted R2 coefficient = 0.639 shows that the fit of the model is relatively high. Thus, the independent variables explain 63.90% of the change of the dependent variable Card service development.
Table 4.11 Coefficients a
Model | Unstandardized Coefficients | Standardized Coefficients | t | Sig. | Collinearity Statistics | |||
REMOVE | Std. Error | Beta | Tole rance | VIF | ||||
first | (Constant) | -,308 | ,213 | -1.446 | ,150 | |||
TL | ,125 | ,043 | ,132 | 2.907 | ,004 | ,809 | 1.236 | |
PL | ,062 | ,026 | ,097 | 2,355 | ,019 | ,980 | 1.021 | |
CN | ,246 | ,041 | ,278 | 6.038 | , 000 | ,791 | 1.264 | |
th | ,279 | ,042 | ,309 | 6.653 | , 000 | ,777 | 1.287 | |
ML | ,193 | ,038 | ,238 | 5.133 | , 000 | ,780 | 1.282 | |
TIEN | ,187 | ,038 | ,229 | 4,972 | , 000 | ,794 | 1.260 | |
a. Dependent Variable: Develop card services. | ||||||||
Source: Survey results, SPSS, 2015
The lowest VIF variance exaggeration factor is 1.021 and the highest is 1.287 < 2, all VIF coefficients are less than 2. Therefore, the author finds that there is no multicollinearity between the factors.
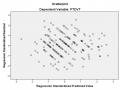
Model fit test: In order to infer this model into the overall model, it is necessary to consider the F-Test through analysis of variance (ANOVA) as shown in Table 4.22. Because of Sig. = 0.000, we reject the hypothesis that the overall coefficient of determination R2 = 0, which means that at least one independent variable has an influence on the dependent variable. The multiple linear regression model fits the data set and is usable.
Table 4.12 Test of the fit of the regression model
Model | Sum of squares | DF | Mean squared | F | sig, | |
first | Regression | 12,242 | 6 | 2.040 | 64,556 | 000 b |
Surplus | 6.606 | 209 | ,032 | |||
Total | 18,848 | 215 | ||||
a. Dependent Variable: PTDVT | ||||||
b. Predictors: (Constant), TI, PL, TH, TL, CN, ML | ||||||
Source: Survey results, SPSS, 2015
Looking at the Coefficients table , we see that the VIF coefficients of the factors are all < 2, so there is no multicollinearity phenomenon in the model.
According to the Table of Coefficients a we see:
- TL has a value of Sig = 0.004 < 0.05, so TQM has a significant correlation with PTDVT with 95% confidence.
- PL has a value of Sig = 0.019 < 0.05, so PLCS has a significant correlation with PTDVT with 95% confidence.
- CN, TH, ML and TI have Sig value = 0.00 < 0.05, so CN, TH, ML, TI are significantly correlated with PTDVT with 95% confidence.
The independent variables TI, PL, TH, TL, CN, ML have coefficients β>0, showing a positive influence with variable Y (PTDVT).
Thus, the multiple linear regression equation is written as follows:
PTDVT = -0.308+ 0.125*TL + 0.062*PL + 0.246*CN + 0.279*TH + 0.193*ML + 0.187*TI + i