The most surveyed sample is long-term customers (over 3 years of using Navibank services, accounting for 36.7%).
And customers are relatively satisfied with Navibank’s banking services, so 63.9% of respondents are willing to recommend Navibank services to others and will continue to transact with Navibank when there is a need in the future.
Table 2.7 : Descriptive statistics of satisfaction evaluation factors Descriptive Statistics
| WOMEN | Minimum | Maximum | Mean | Std. Deviation | |
| TT1 | 166 | 2 | 5 | 3.36 | .689 |
| TT2 | 166 | 1 | 5 | 3.20 | .618 |
| TT3 | 166 | 1 | 5 | 3.20 | .674 |
| TT4 | 166 | 2 | 5 | 3.42 | .787 |
| TT5 | 166 | 1 | 5 | 3.08 | .713 |
| PH1 | 166 | 2 | 5 | 3.31 | .736 |
| PH2 | 166 | 2 | 5 | 3.27 | .818 |
| PH3 | 166 | 2 | 5 | 3.28 | .695 |
| PH4 | 166 | 2 | 5 | 3.17 | .609 |
| DB1 | 166 | 1 | 5 | 3.13 | .740 |
| DB2 | 166 | 1 | 5 | 3.16 | .708 |
| DB3 | 166 | 2 | 5 | 3.25 | .711 |
| DB4 | 166 | 2 | 5 | 3.07 | .666 |
| CT1 | 166 | 2 | 5 | 2.94 | .768 |
| CT2 | 166 | 2 | 5 | 3.33 | .708 |
| CT3 | 166 | 2 | 5 | 3.27 | .812 |
| CT4 | 166 | 2 | 5 | 2.96 | .664 |
| HH1 | 166 | 1 | 5 | 2.73 | .646 |
| HH2 | 166 | 1 | 4 | 2.75 | .655 |
| HH3 | 166 | 1 | 5 | 2.82 | .690 |
| HH4 | 166 | 1 | 4 | 2.72 | .659 |
| HH5 | 166 | 2 | 5 | 2.71 | .652 |
| HL1 | 166 | 2 | 5 | 3.27 | .689 |
| HL2 | 166 | 2 | 5 | 3.16 | .699 |
| HL3 | 166 | 2 | 5 | 3.01 | .713 |
| Valid N (listwise) | 166 |
Maybe you are interested!
-

 List Of Banking Services Being Performed At Nam Viet Commercial Joint Stock Bank
 -
 Evaluate The Level Of Development Of Banking Services Through Swot Analysis At Navibank.
 -
 Survey On Customer Satisfaction About Banking Services Of Nam Viet Commercial Joint Stock Bank.
 -
 Solutions For Developing Banking Services Of Nam Viet Commercial Joint Stock Bank.
 -
 Improving The Capacity And Role Of The State Bank In Managing Monetary Policy And Stabilizing The Economy
 -
 Developing banking services at Nam Viet Commercial Joint Stock Bank - 11
Through the statistical table describing the factors to assess the level of satisfaction, we see that the factors that are most satisfied by customers are TT4 – Navibank keeps information well for customers (3.42), TT1 – Navibank always performs fulfill its commitment to you about banking services (3.36).
Besides, empathy and tangible factors are the two factors that customers are least satisfied with such as whether CT1 – Navibank calls or sends greeting cards to you on birthdays, holidays, New Year… (2.94). ), CT4 – Regular sweepstakes or gift giving programs for you (2.96), HH4 – Convenient parking for customers (2.72), HH5 – Wide transaction network (2.71)
In summary, through the survey, we find that tangible factors and empathy are the two factors that are least satisfied by customers. To explain this problem, it is that Navibank does not really care about customers. Currently, Navibank only has a policy to care about customers with large deposit balances, depositing terms of three months or more. will receive birthday gifts, Tet gifts… The policy is that, but the implementation is not uniform, there are some PGDs still not implementing, or forgetting to implement. As for other customers, Navibank currently does not have any specific policies or programs to take care of them.
Currently, customer care at Navibank is only spontaneous, not really professional. Navibank also does not often have promotions, lucky draws and if there are, it is very monotonous, mainly for deposit services, sometimes there are promotions for card services, but promotions This does not bring much enjoyment to customers. Especially, Navibank rarely invests in giving gifts to customers. Customers have not found that their needs are understood, nor have they felt the importance of Navibank’s benefits for them.
It is possible that in the process of communicating with customers, Navibank staff have not thoroughly understood the needs of customers, they have only met specific needs from customers. Therefore, customers feel that Navibank is no different from other banks. Regarding the tangible factor, the parking space is not convenient. Currently, in most transaction offices, there is no parking space for customers, leading to inconvenience for customers, especially when dealing with large amounts of money. The fact that the transaction network is not widespread is also a disadvantage in terms of geography of Navibank.
2.6.3.2 Evaluation of the scale by Cronbach Alpha reliability coefficient:
The scales were evaluated through Cronbach’s Alpha coefficient and exploratory factor analysis (EFA). Cronbach’s Alpha coefficient must be between 0.6 and 1.0 to ensure that the variables in the same group of factors are significantly correlated.
According to the survey results obtained:
Trust consists of 05 observed variables from TT1 to TT5. After checking the reliability coefficient of Cronbach Alpha for the first time, the observed variable TT5 has a total correlation coefficient of less than 0.3, so it is excluded from the model. In the second test, all components have variables with a total correlation coefficient greater than 0.3, so all variables are accepted. The Cronbach Alpha coefficient is quite high from 0.6 and above, so the scales are satisfactory.
Table 2.8: Cronbach Alpha coefficient of the scale components
| Scale Mean if Item Deleted | Scale Variance if Item Deleted | Corrected Item-Total Correlation | Cronbach’s Alpha if Item Deleted |
Confidence (TT) when not eliminating variable TT5: Cronbach’s Alpha = 0.716
| TT1 | 12.90 | 3.930 | .478 | .666 |
| TT2 | 13.06 | 4.093 | .494 | .663 |
| TT3 | 13.06 | 3.608 | .643 | .600 |
| TT4 | 12.85 | 3.559 | .516 | .651 |
| TT5 | 13.19 | 4.383 | .274 | .746 |
Confidence (TT) after eliminating variable TT5: Cronbach’s Alpha = 0.746
| TT1 | 9.83 | 2.715 | .526 | .695 |
| TT2 | 9.98 | 2.903 | .522 | .699 |
| TT3 | 9.98 | 2.769 | .516 | .700 |
| TT4 | 9.77 | 2.311 | .606 | .649 |
Feedback (PH): Cronbach’s Alpha = 0.775
| PH1 | 9.72 | 2.968 | .562 | .730 |
| PH2 | 9.76 | 2.766 | .551 | .743 |
| PH3 | 9.74 | 2.848 | .683 | .667 |
| PH4 | 9.86 | 3.349 | .544 | .742 |
Guarantee (DB): Cronbach’s Alpha = 0.750
| DB1 | 9.49 | 2.760 | .511 | .713 |
| DB2 | 9.45 | 2.746 | .562 | .683 |
| DB3 | 9.36 | 2.850 | .504 | .715 |
| DB4 | 9.54 | 2.771 | .610 | .659 |
Sympathy (CT): Cronbach’s Alpha = 0.750
| CT1 | 9.56 | 2.478 | .629 | .531 |
| CT2 | 9.17 | 2.893 | .497 | .623 |
| CT3 | 9.23 | 3.026 | .320 | .740 |
| CT4 | 9.54 | 2.977 | .512 | .618 |
Tangibility (HH): Cronbach’s Alpha = 0.783
| HH1 | 11.00 | 4.012 | .544 | .747 |
| HH2 | 10.98 | 4.266 | .421 | .786 |
| HH3 | 10.91 | 3.998 | .493 | .764 |
| HH4 | 11.01 | 3.685 | .678 | .701 |
| HH5 | 11.02 | 3.727 | .669 | .705 |
Satisfaction (HL): Cronbach’s Alpha = 0.723
| HL1 | 6.17 | 1.406 | .588 | .581 |
| HL2 | 6.28 | 1.499 | .500 | .687 |
| HL3 | 6.43 | 1.410 | .545 | .634 |
2.6.3.3 Evaluation of the scale by exploratory factor analysis EFA
Factor analysis explores independent variables: v A necessary condition for the application of factor analysis is that the variables must be correlated with each other (measured variables reflect different aspects of the same common factor). should use Bartlett test to consider whether the variables have correlation in the population and the sufficient condition to conduct factor analysis is that the KMO (Kaiser-Mayer-Olkin) value must be from 0.5 to 1 (followed by Hoang Trong and Chu Nguyen Mong Ngoc, 2005). Extraction of representative factors by observed variables is done by method of extracting Principal components with Varimax rotation and factor loading factor must be > 0.5. Components with Eighenvalues > 1 and total variance extracted ≥ 0.5 are considered as representative variables.
Satisfaction scale is measured by 22 observed variables, after checking the reliability by Cronbach alpha analysis, the TT5 variable is removed, leaving 21 observed variables. EFA exploratory factor analysis was used to re-evaluate the degree of convergence of 21 observed variables according to the components.
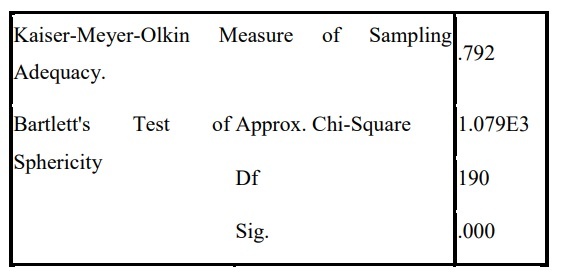
The results of the first analysis show that the KMO coefficient is quite high at 0.792 and the significance level is zero, indicating that the factor analysis is appropriate. After using the method of factor extraction and rotation, the factor analysis method showed that CT3 has a load factor <0.5 (Appendix 3.1) so it was excluded from the analysis. we proceed to run the EFA again.
Table 2.9: Result of factor analysis for the 2nd time exploratory scale
KMO and Bartlett’s Test
Rotated Component Matrixa
| Component | |||||
| 1 | 2 | 3 | 4 | 5 | |
| HH4 | .829 | ||||
| HH5 | .811 | ||||
| HH1 | .723 | ||||
| HH3 | .625 | ||||
| HH2 | .607 | ||||
| DB4 | .788 | ||||
| DB2 | .683 | ||||
| DB1 | .675 | ||||
| DB3 | .675 | ||||
| PH3 | .831 | ||||
| PH2 | .772 | ||||
| PH4 | .722 | ||||
| PH1 | .661 | ||||
| TT2 | .774 | ||||
| TT4 | .732 | ||||
| TT3 | .728 | ||||
| TT1 | .622 | ||||
| CT4 | .831 | ||||
| CT1 | .801 | ||||
| CT2 | .690 |
Extraction Method: Principal Component Analysis. Rotation Method: Varimax with Kaiser Normalization. a. Rotation converged in 5 iterations.
After eliminating unsatisfactory variables, EFA exploratory factor analysis results in customer satisfaction remaining 5 components with 20 observed variables. The EFA analysis conditions are satisfied: KMO = 0.792>0.5, sig.<0.05, the factor upload coefficients are all >0.5. Total extracted variance = 60.148% (greater than 50%) shows that the extracted variance is satisfactory. Thus, with 5 components TT, PH, DB, CT, HH will explain 60.148% variation of the data.
Factor analysis explores the dependent variable
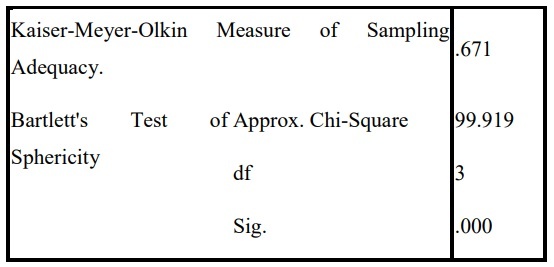
Table 2.10: Results of factor analysis to explore the satisfaction scale
KMO and Bartlett’s Test
Component Matrixa
| Component | |
| 1 | |
| HL1 | .834 |
| HL3 | .805 |
| HL2 | .768 |
Extraction Method: Principal Component Analysis. a. 1 components extracted.
The EFA analysis conditions are satisfied:
– KMO = 0.671 > 0.5, Sig. < 0.05
– Total variance extracted = 64,420 > 50%
– The upload factors are all > 0.5
Extracted a single dependent factor with three observed variables HL1, HL2, HL3.
2.6.3.4 Multiple linear regression analysis, testing hypotheses and research models
Pearson correlation coefficient test:
Before conducting multiple linear regression analysis, we need to test the linear correlation between the variables in the model: between the dependent variable and each independent variable and between the independent variables. Using the Pearson correlation coefficient to quantify the closeness of the linear relationship between two quantitative variables: the closer the absolute value of Pearson’s coefficient is to 1, the more closely these two variables have a linear correlation. (Hoang Trong & Chu Nguyen Mong Ngoc, 2005).
Linear regression analysis:
The factors extracted in factor analysis are used for linear regression analysis to test the research model and accompanying hypotheses. Statistical hypothesis tests applied at the 5% level of significance.
The study performed multiple linear regression by Enter method: all variables were included once and related statistical results were considered.
The multiple regression equation for the proposed research model after preliminary research is as follows:
Y = 5*X5 + Eb4*X4+b3*X3+ b2*X2 + b1*X1+ b0 + b
Inside:
+Y is the dependent variable that represents the predictive value of customer satisfaction.
5 are regression coefficients b4, b3, b2, b1, b0 ,b+
+ X1, X2, X3, X4, X5 are the independent variables in the order of assuming: Trust, Feedback, Assurance, Empathy, Tangibility, Satisfaction.
+E are unknown factors
Test your hypotheses:
To test the fit of the model, the researchers use the coefficient of determination R2 (R-square) to assess the fit of the research model, the coefficient of determination R2 is proven to be a function of zero. decreases with the number of independent variables included in the model. Besides, it is necessary to check that there is no multicollinearity with the variance inflation factor (VIF): VIF<2. The higher the standardized beta coefficient of any variable, the greater its impact on customer satisfaction (following Hoang Trong and Chu Nguyen Mong Ngoc, 2005).
Table 2.11 : Results of running multiple linear regression
Variables Entered/Removedb
| Model | Variables Entered | Variables Removed | Method |
| 1 | PH, HH, CT, TT, DBa | Enter |
a. All requested variables entered.
b. Dependent Variable: HL
Model Summary
| Model | R | R Square | Adjusted R Square | Std. Error of the Estimate |
| 1 | .727a | .528 | .513 | .39211 |
a. Predictors: (Constant), PH, HH, CT, TT, DB
ANOVAb
| Model | Sum of Squares | Df | Mean Square | F | Sig. |
| 1 Regression Residual Total | 27.500 24.600 52.100 | 5 160 165 | 5.500 .154 | 35.773 | .000a |
b. Dependent Variable: HL
Regression linear regression analysis method with 5 components of customer satisfaction included at the same time (enter) shows that the regression model is suitable to use to test the hypothesis (sig. = 0.000) . The level of explaining the relationship between components by this regression method gives the results R2 (R-quare) = 0.528 and adjusted R2 (Adjusted R-quare) = 0.513, showing that the model’s compatibility is 51.3. % or about 51.3% variance of satisfaction is explained by five components: trust, feedback, assurance, empathy, tangibles.
According to the correlation matrix (Table 2.13), it shows that the correlation coefficient between satisfaction variable – HL (dependant variable) with each independent variable is greater than 0.3, so the dependent variable has a linear correlation with the independent variables. create. The analysis results also show that some independent variables are correlated with each other, so when analyzing regression, it is necessary to pay attention to the problem of multicollinearity.
Table 2.12 : Pearson Correlations . test results
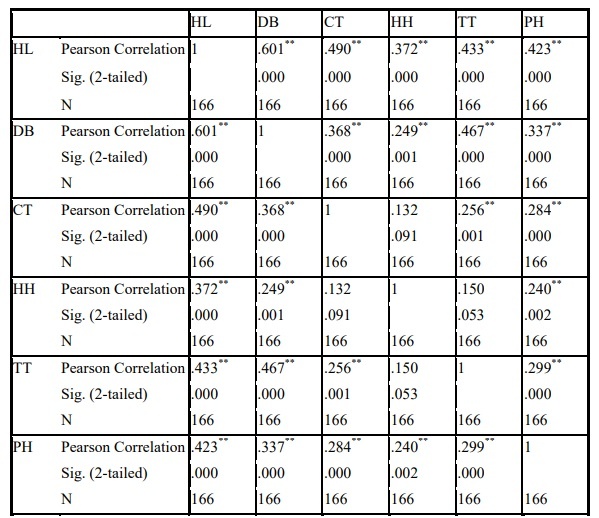
**. Correlation is significant at the 0.01 level (2-tailed).
Table 2.13: Results of regression coefficient analysis
Coefficientsa
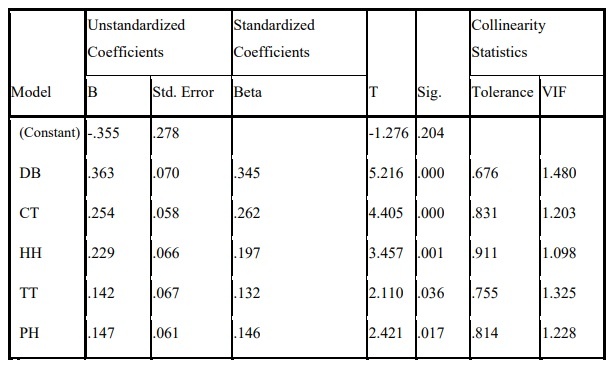
a. Dependent Variable: HL
The variance inflation factor (VIF) of all factors is less than 2, showing that these independent variables are not closely related, so there is no multicollinearity phenomenon. Therefore, the relationship between the independent variables does not significantly affect the explanatory results of the regression model.
On the other hand, through Anova analysis, we see that the sig value is 0.000 < 0.05, which means that the hypothesis H0 is rejected (β1=β2=β3=β4=β5=0).
Regression coefficients with positive signs show that the factors in the regression model positively affect customer satisfaction. Regression coefficient of which factor is larger will have more impact on customer satisfaction. Therefore, the order of impact level of factors on customer satisfaction is as follows:
Table 2.14: Order of impact levels of factors on customer satisfaction
| Number | Beta coefficient | Factor |
| first. | 0.345 | Guarantee |
| 2. | 0.262 | Sympathy |
| 3. | 0.197 | The tangible |
| 4. | 0.146 | Feedback |
| 5. | 0.132 | Trust |
Thus, after running the regression and testing the statistical hypotheses, we draw the regression model as follows:
Satisfaction = 0.345* Assurance + 0.262* Empathy + 0.197 * Tangibles +0.146* Feedback + 0.132* Trust + E
2.6.3.5 Anova . test
Analyze the difference between the attributes of the research object and the dependent variable (Customer satisfaction) in the research model. A summary analysis table is presented below (for details see Appendix 5 – ANOVA Analysis)
Table 2.15: Analysis of differences by attributes of research subjects
| Attributes | Levene Statistics (sig.) | Anova Analytics (sig.) |
| Sex | .631 | .993 |
| Age | .287 | .372 |
| Income | .421 | .001 |
| Used Time | .71 | .000 |
| Service Introduction | .218 | .000 |
| Future needs | .147 | .001 |
Analysis of differences by sex
This test shows whether the variance of customer satisfaction is equal or different between Female and Male. Sig of Levene statistic = 0.631 (>0.05), so at 95% confidence level, hypothesis H0: “Equal variances” is accepted, and hypothesis H1: “Different variances” is rejected. Therefore, the results of ANOVA analysis can be used.