Biến phụ thuộc
Kaiser-Meyer-Olkin Measure of Sampling Adequacy. | .715 | |
Bartlett's Test of Sphericity | Approx. Chi-Square | 159.666 |
df | 3 | |
Sig. | .000 | |
Có thể bạn quan tâm!
-
 Các yếu tố tác động đến ý định sử dụng dịch vụ Chính phủ điện tử - Nghiên cứu trường hợp ngành thuế Tỉnh Long An - 8
 -
 Kiến Nghị Từ Kết Quả Nghiên Cứu
 -
 Các yếu tố tác động đến ý định sử dụng dịch vụ Chính phủ điện tử - Nghiên cứu trường hợp ngành thuế Tỉnh Long An - 10
 -
 Các yếu tố tác động đến ý định sử dụng dịch vụ Chính phủ điện tử - Nghiên cứu trường hợp ngành thuế Tỉnh Long An - 12
Xem toàn bộ 100 trang tài liệu này.
Compone nt | Initial Eigenvalues | Extraction Sums of Squared Loadings | ||||
Total | % of Variance | Cumulative % | Total | % of Variance | Cumulative % | |
1 | 2.282 | 76.077 | 76.077 | 2.282 | 76.077 | 76.077 |
2 | .422 | 14.053 | 90.130 | |||
3 | .296 | 9.870 | 100.000 | |||
Extraction Method: Principal Component Analysis. | ||||||
PHỤ LỤC 4 PHÂN TÍCH HỒI QUY VÀ HỆ SỐ TƯƠNG QUAN
Model | Variables Entered | Variables Removed | Method |
1 | X5, X1, X4, X3, X2b | . | Enter |
a. Dependent Variable: Y | |||
b. All requested variables entered. | |||
Model | R | R Square | Adjusted R Square | Std. Error of the Estimate | Change Statistics | Durbin- Watson | ||||
R Square Change | F Change | df1 | df2 | Sig. F Chang e | ||||||
1 | .851a | .724 | .713 | .5202418 | .724 | 65.030 | 5 | 124 | .000 | 1.878 |
a. Predictors: (Constant), X5, X1, X4, X3, X2 | ||||||||||
b. Dependent Variable: Y | ||||||||||
Model | Sum of Squares | df | Mean Square | F | Sig. | ||
1 | Regression | 88.002 | 5 | 17.600 | 65.030 | .000b | |
Residual | 33.561 | 124 | .271 | ||||
Total | 121.563 | 129 | |||||
a. Dependent Variable: Y | |||||||
b. Predictors: (Constant), X5, X1, X4, X3, X2 | |||||||
Y | X1 | X2 | X3 | X4 | X5 | ||
Y | Pearson Correlation | 1 | .570** | .659** | .595** | .628** | .620** |
Sig. (2-tailed) | .000 | .000 | .000 | .000 | .000 | ||
N | 130 | 130 | 130 | 130 | 130 | 130 | |
X1 | Pearson Correlation | .570** | 1 | .315** | .342** | .308** | .306** |
Sig. (2-tailed) | .000 | .000 | .000 | .000 | .000 | ||
N | 130 | 130 | 130 | 130 | 130 | 130 | |
X2 | Pearson Correlation | .659** | .315** | 1 | .388** | .567** | .566** |
Sig. (2-tailed) | .000 | .000 | .000 | .000 | .000 | ||
N | 130 | 130 | 130 | 130 | 130 | 130 | |
Pearson Correlation | .595** | .342** | .388** | 1 | .369** | .450** | |
Sig. (2-tailed) | .000 | .000 | .000 | .000 | .000 | ||
N | 130 | 130 | 130 | 130 | 130 | 130 | |
X4 | Pearson Correlation | .628** | .308** | .567** | .369** | 1 | .429** |
Sig. (2-tailed) | .000 | .000 | .000 | .000 | .000 | ||
N | 130 | 130 | 130 | 130 | 130 | 130 | |
X5 | Pearson Correlation | .620** | .306** | .566** | .450** | .429** | 1 |
Sig. (2-tailed) | .000 | .000 | .000 | .000 | .000 | ||
N | 130 | 130 | 130 | 130 | 130 | 130 | |
**. Correlation is significant at the 0.01 level (2-tailed). | |||||||
Model | Unstandardized Coefficients | Standardized Coefficients | t | Sig. | Collinearity Statistics | |||
B | Std. Error | Beta | Tolerance | VIF | ||||
1 | (Constant) | -1.152 | .348 | -3.314 | .001 | |||
X1 | .293 | .054 | .284 | 5.467 | .000 | .825 | 1.212 | |
X2 | .258 | .071 | .235 | 3.660 | .000 | .542 | 1.846 | |
X3 | .222 | .053 | .231 | 4.171 | .000 | .723 | 1.383 | |
X4 | .243 | .060 | .239 | 4.046 | .000 | .637 | 1.570 | |
X5 | .200 | .063 | .193 | 3.183 | .002 | .606 | 1.651 | |
a. Dependent Variable: Y | ||||||||
Minimum | Maximum | Mean | Std. Deviation | N | |
Predicted Value | .753766 | 7.125405 | 4.971795 | .8259477 | 130 |
Residual | -1.3428757 | 1.2370565 | 0E-7 | .5100600 | 130 |
Std. Predicted Value | -5.107 | 2.607 | .000 | 1.000 | 130 |
Std. Residual | -2.581 | 2.378 | .000 | .980 | 130 |
a. Dependent Variable: Y | |||||
PHỤ LỤC 5 KIỂM ĐỊNH T-TEST
GT | N | Mean | Std. Deviation | Std. Error Mean | |
Y | Nam | 71 | 5.028169 | .8886345 | .1054615 |
Nữ | 59 | 4.903955 | 1.0650326 | .1386554 |
Levene's Test for Equality of Variances | t-test for Equality of Means | |||||||||
F | Sig. | t | df | Sig. (2- tailed) | Mean Difference | Std. Error Differenc e | 95% Confidence Interval of the Difference | |||
Lower | Upper | |||||||||
Y | Equal variances assumed | 1.157 | .284 | .725 | 128 | .470 | .1242142 | .1713258 | -.2147831 | .4632116 |
Equal variances not assumed | .713 | 113.144 | .477 | .1242142 | .1742052 | -.2209130 | .4693414 | |||
PHỤ LỤC 6 KIỂM ĐỊNH KẾT QUẢ HỒI QUY
Model | Variables Entered | Variables Removed | Method |
1 | HT, GT, KNb | . | Enter |
a. Dependent Variable: Y | |||
b. All requested variables entered. | |||
Model | R | R Square | Adjusted R Square | Std. Error of the Estimate | Change Statistics | Durbin- Watson | ||||
R Square Change | F Change | df1 | df2 | Sig. F Change | ||||||
1 | .116a | .013 | -.010 | .9756336 | .013 | .570 | 3 | 126 | .636 | 1.845 |
a. Predictors: (Constant), HT, GT, KN | ||||||||||
b. Dependent Variable: Y | ||||||||||
Model | Sum of Squares | df | Mean Square | F | Sig. | |
1 | Regression | 1.629 | 3 | .543 | .570 | .636b |
Residual | 119.934 | 126 | .952 | |||
Total | 121.563 | 129 | ||||
a. Dependent Variable: Y | ||||||
b. Predictors: (Constant), HT, GT, KN | ||||||
Model | Unstandardize d Coefficients | Standardized Coefficients | t | Sig. | Collinearity Statistics | |||
B | Std. Error | Beta | Tolerance | VIF | ||||
1 | (Constant) | 5.160 | .213 | 24.231 | .000 | |||
GT | -.111 | .172 | -.057 | -.641 | .523 | .993 | 1.007 | |
KN | .034 | .062 | .084 | .547 | .585 | .331 | 3.025 | |
HT | -.069 | .070 | -.153 | -.990 | .324 | .330 | 3.032 | |
a. Dependent Variable: Y | ||||||||
Minimum | Maximum | Mean | Std. Deviation | N | |
Predicted Value | 4.735921 | 5.329137 | 4.971795 | .1123660 | 130 |
Residual | -3.5064883 | 2.0146818 | 0E-7 | .9642223 | 130 |
Std. Predicted Value | -2.099 | 3.180 | .000 | 1.000 | 130 |
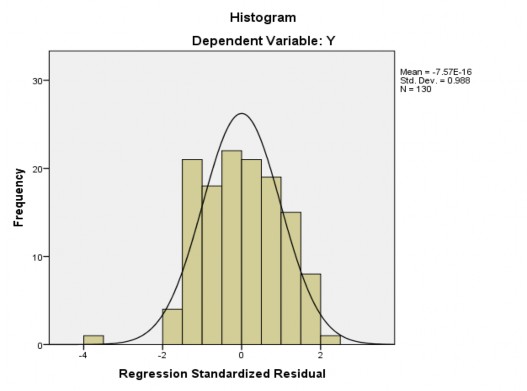
Std. Residual | -3.594 | 2.065 | .000 | .988 | 130 |
a. Dependent Variable: Y | |||||