Having an account at a bank and limited access to bank credit.
If the business has an account at the bank, the bank can monitor the transactions as well as the cash flow of the business, when there is a risk, the bank can block the account to ensure its interests. In addition, this also proves that enterprises have a relationship with banks, which increases their ability to access bank credit.
Hypothesis H8: The company has a bank account has a negative (-) effect on the ability to have limited access to bank credit.
The impact of independent variables on restricted access to bank credit is summarized in the following table:
Table 2.2 Summary of hypotheses
| Variable | Definition | Direction of impact to dependent variable |
| AGE | Number year of operation of the company | – |
| SALESINC | Get a raise revenue growth | – |
| FIXEDINC | Get a raise head of fixed assets | – |
| NOPROFIT | Are not profitable | + |
| MEDIUM | Quy medium company size (according to total sources capital and depending on industry) | – |
| LARGE | Quy large company size (according to total source capital and depending on industry) | – |
| FEMALE | Gender The owner of the company is female | + |
| ACCOUNTS | Finance bank account | – |
Maybe you are interested!
-

 Factors affecting the ability to access bank credit of enterprises listed on the stock market - 1
 -
 Factors affecting the ability to access bank credit of enterprises listed on the stock market - 2
 -
 Current Status Of Listed Companies On Vietnam Stock Market
 -
 Factors affecting the ability to access bank credit of enterprises listed on the stock market - 4
 -
 Factors affecting the ability to access bank credit of enterprises listed on the stock market - 6
CHAPTER 2 SUMMARY
In this chapter, the author has described the research data and presented in detail the research method. Research data is audited financial statements of 242 enterprises listed on Vietnam stock exchange (including 102 samples of Ho Chi Minh Stock Exchange and 140 samples of Hanoi Stock Exchange) over a period of 3 years. year from 2010-2012. The research model is a multivariable probit model, the dependent variable is the variable that cannot borrow from banks, the independent variable includes 8 variables: the number of years of operation of the company; increase the revenue; fixed asset growth; unprofitable; medium sized company; large company scale; the gender of the company owner is female; Bank account. The data processing will be done on SPSS 18.0 software and the research results will be presented in detail in Chapter 3.
CHAPTER 3
RESEARCH RESULTS
3.1. Descriptive statistics
3.1.1. General Statistics
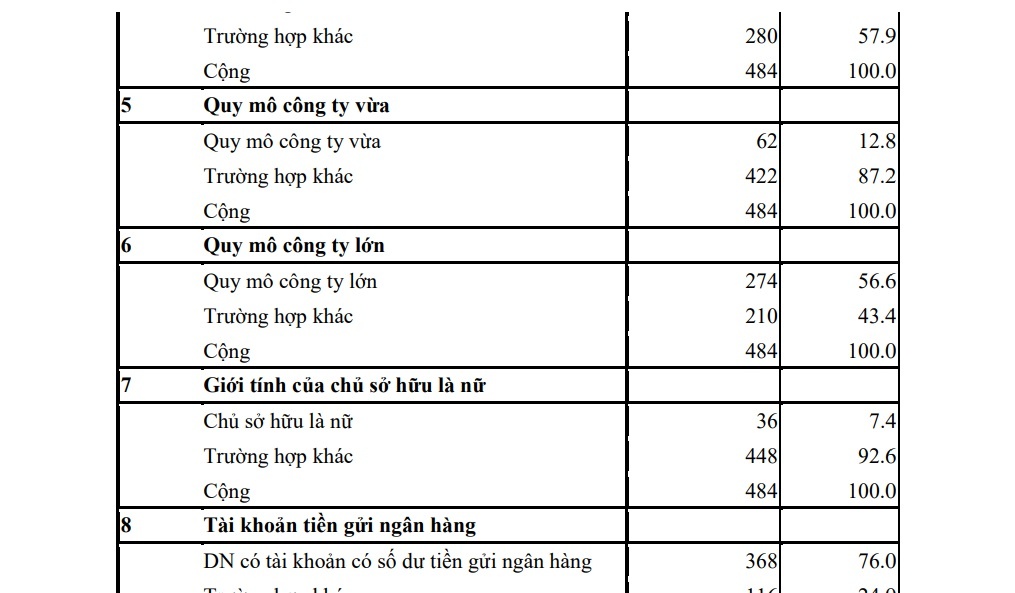
Table 3.1 shows some general statistical indicators of the research data. In 484 research samples, there are 276 cases where companies are not allowed to borrow money from banks, accounting for 57% of the sample and the rest are other cases. Similarly, if classified according to some other variables such as revenue growth, fixed asset growth, profit, size, owner, bank account, largest controlling stakeholder; and the resulting export growth is shown in the following table 3.1:
Table 3.1 General Statistics
| Number | Criteria for grouping | Frequency | Ratio (%) |
| 1 | Can’t get a bank loan | ||
| Labour you can’t get a bank loan | 276 | 57.0 | |
| School other case | 208 | 43.0 | |
| Add | 484 | 100.0 | |
| 2 | Sales growth | ||
| Business Revenue increased compared to the previous year | 294 | 60.7 | |
| School other case | 190 | 39.3 | |
| Add | 484 | 100.0 | |
| 3 | Fixed Asset Growth | ||
| Finance fixed assets increase or stay the same compared to year before | 310 | 64.0 | |
| School other case | 174 | 36.0 | |
| Add | 484 | 100.0 | |
| 4 | No profit | ||
| DN unprofitable | 204 | 42.1 | |
| School other case | 280 | 57.9 | |
| Add | 484 | 100.0 | |
| 5 | medium sized company | ||
| Quy medium size company | 62 | 12.8 | |
| School other case | 422 | 87.2 | |
| Add | 484 | 100.0 | |
| 6 | Large company size | ||
| Quy large company size | 274 | 56.6 | |
| School other case | 210 | 43.4 | |
| Add | 484 | 100.0 | |
| 7 | Owner’s gender is female | ||
| Owner owned is female | 36 | 7.4 | |
| School other case | 448 | 92.6 | |
| Add | 484 | 100.0 | |
| 8 | Bank deposit account | ||
| DN have an account with a bank deposit balance | 368 | 76.0 | |
| School other case | 116 | 24.0 | |
| Add | 484 | 100.0 | |
| 9 | The person holding the largest controlling share | ||
| Home water | 72 | 14.9 | |
| School other case | 412 | 85.1 | |
| Add | 484 | 100.0 | |
| 10 | Export growth | ||
| Export export increase | 44 | 9.1 | |
| School other case | 440 | 90.9 | |
| Add | 484 | 100.0 |
3.1.2. Descriptive statistics of observed variables
The descriptive statistics of the observed variables are shown in Table 3.2.
Table 3.2 Descriptive Statistics
| . | WOMEN | Minimum | Maximum | Mean | Std. Deviation |
| NL | 484 | 0 | first | .57 | .496 |
| AGE | 484 | 2 | 58 | 21.52 | 13.386 |
| SALESINC | 484 | 0 | first | .sixty one | .489 |
| FIXEDINC | 484 | 0 | first | .sixty four | .481 |
| NOPROFIT | 484 | 0 | first | .42 | .495 |
| MEDIUM | 484 | 0 | first | .13 | .335 |
| LARGE | 484 | 0 | first | .57 | .497 |
| FEMALE | 484 | 0 | first | .07 | .263 |
| ACCOUNTS | 484 | 0 | first | .76 | .428 |
| OWN | 484 | 0 | first | .76 | .427 |
| SECTOR1 | 484 | 0 | first | .05 | .226 |
| SECTOR2 | 484 | 0 | first | .01 | .111 |
| SECTOR3 | 484 | 0 | first | .01 | .111 |
| SECTOR4 | 484 | 0 | first | .19 | .396 |
| SECTOR5 | 484 | 0 | first | .02 | .143 |
| SECTOR6 | 484 | 0 | first | .03 | .179 |
| SECTOR7 | 484 | 0 | first | .06 | .234 |
| NC | 484 | first | 32 | 8.86 | 8040 |
| EXPINC | 484 | 0 | first | .09 | .288 |
| DOMESTIC | 484 | 5 | 100 | 92.30 | 20.531 |
| Valid N (listwise) | 484 |
Source: Author’s calculations from SPSS 18
In Table 3.2, we see, the highest number of years of operation of the company is 58 years, the lowest is 2 years (from the year of establishment to 2010). The mean of years of operation is 21.5 years. Thus, the majority of enterprises listed on the Vietnamese stock market have a relatively high number of years of operation.
Regarding the percentage of domestic sales, the highest value is 100%, the lowest value is 5%. The average rate of domestic revenue of enterprises listed on Vietnam’s stock market is 92.3%. This is a relatively high rate, proving that companies listed on Vietnam’s stock market only focus on the domestic market. In the coming time, in order to improve access to bank credit, enterprises listed on Vietnam’s stock market need to further promote their export activities.
We can see that NL is a dummy variable that is measured with two values of 1 or 0, so it is not possible to evaluate descriptive statistics. Similarly, variables SALESINC, FIXEDINC, NOPROFIT, MEDIUM, LARGE, FEMALE, ACCOUNTS, OWN, SECTOR1, SECTOR2, SECTOR3, SECTOR4, SECTOR5, SECTOR6, SECTOR7, and EXPINC are also dummy variables, so the indices cannot be evaluated. Descriptive statistics.
3.2. Correlation analysis
In probability theory and statistics, the correlation coefficient indicates the strength of the linear correlation between two random variables. Correlation analysis helps the author to have a preliminary view of the relationship of the variables in the model. The following table shows the correlation coefficients between the variables.
Table 3.3 Correlation between variables
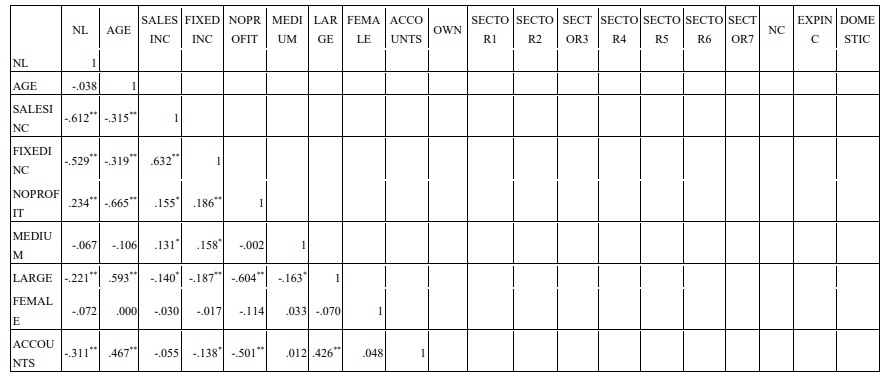
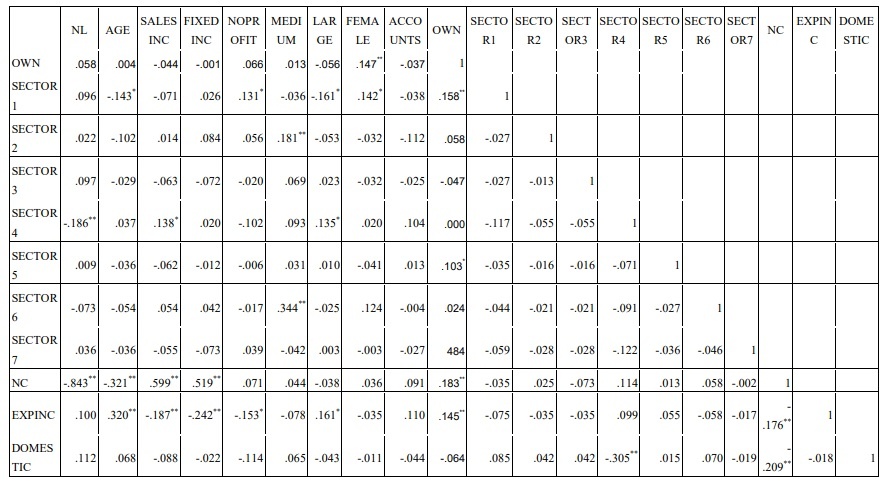
Source: Author’s calculations from SPSS 18
The correlation coefficient is used to quantify how closely two variables have a linear relationship. The closer the absolute value of the correlation coefficient is to 1, the closer the linear relationship between the two variables.
The correlation coefficient matrix in the above table shows that NL has a close relationship with NC. NL has average correlation with SALESINC, FIXEDINC. And NL has a weak correlation with NOPROFIT, LARGE, ACCOUNTS, SECTOR4 (statistical significance level 5%).
In addition, NL also has relationships with DOMESTIC, FEMALE, SECTOR7, EXPINC, SECTOR3, SECTOR2, SECTOR5, OWN, SECTOR6, SECTOR1, MEDIUM, AGE, however the coefficient sig. of these relationships >10%, so there is no statistical significance.
As mentioned above, correlation analysis only helps the author to have a preliminary view of the relationship of the variables in the model. To analyze and test more deeply, the author conducts regression analysis in the next section.
3.3. Model testing
Table 3.4 Indicators to assess the fit of the model
| Model | R | R Square | Adjusted R Square | Std. Error of the Estimate |
| 1 | .944 a | .890 | .886 | .167 |
Source: Author’s calculations from SPSS 18
a. Predictors: (Constant), DOMESTIC, FEMALE, SECTOR7, EXPINC, SECTOR3, SECTOR2, SECTOR5, OWN, SECTOR6, SECTOR1, ACCOUNTS, SALESINC, MEDIUM, SECTOR4, LARGE, FIXEDINC, NC, NOPROFIT, AGE
b. Dependent Variable: NL
The adjusted R2 in this model is 0.886. This shows that 88.6% of the variation of the variable can’t get a bank loan (NL) is generally explained by 19 independent variables AGE , FIXEDINC, FEMALE, MEDIUM, LARGE, NOPROFIT, ACCOUNTS, SALESINC, DOMESTIC, SECTOR7, EXPINC, SECTOR3, SECTOR2, SECTOR5, SECTOR6, OWN, SECTOR1, SECTOR4, NC.
Table 3.5 Indicators of model testing
| Model | Sum of Squares | Df | Mean Square | F | Sig. | |
| 1 | Regression Residual Total | 105.589 13.022 118.612 | 19 5 464 483 | .557 .028 | 198.014 | .000a |
Source: Author’s calculations from SPSS 18
a. Predictors: (Constant), DOMESTIC, FEMALE, SECTOR7, EXPINC, SECTOR3, SECTOR2, SECTOR5, OWN, SECTOR6, SECTOR1, ACCOUNTS, SALESINC, MEDIUM, SECTOR4, LARGE, FIXEDINC, NC, NOPROFIT, AGE
b. Dependent Variable: NL
The hypothesis is that the construction model does not fit the population
ANOVA analysis showed that parameter F has Sig. = 0.000 (< significance level α=0.01), rejecting the above hypothesis, proving that the built regression model is suitable for the collected data set.
Table 3.6 Regression results of variables in the model
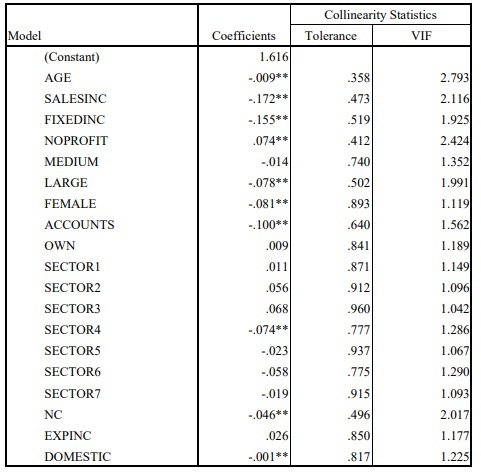
Source: Author’s calculations from SPSS 18
a. Dependent Variable: NL
b. ** Statistical significance level 5%
c. * Statistical significance level 10%
The results of the multicollinearity test show that the model does not have this phenomenon because all the Tolerance coefficients of the variables are > (1-R 2 = 1-0.886 = 0.114) or the coefficient of variance exaggeration. (Variance inflation factor – VIF) of all variables are < 10.
Sig value. of the independent variables DOMESTIC, ACCOUNTS, SALESINC, SECTOR4, LARGE, FIXEDINC, NC, NOPROFIT, FEMALE, AGE are all less than 0.05, we see that the included variables are statistically significant at the 5% level of significance. . Particularly, variables MEDIUM, OWN, SECTOR1, SECTOR2, SECTOR3, SECTOR5, SECTOR6, SECTOR7 and EXPINC all have Sig.F greater than 0.1, so they are not statistically significant. Thus, the regression results show that 10 independent variables in the model (DOMESTIC, ACCOUNTS, SALESINC, SECTOR4, LARGE, FIXEDINC, NC, NOPROFIT, AGE, FEMALE) all affect the dependent variable NL with significance level 5. %.
3.4. Evaluation and evaluation of models
The model results shown in the above tables show the number of years of operation of the company, revenue growth, fixed asset growth, no profit, large company size, gender of the owner is female, ratio Domestic revenue ratios, bank accounts, industry, number of competitors and limited access to bank credit are all related. Statistical parameters of the model all prove that the models are suitable and meaningful. And the explanatory level of the model is high, reflected in the model’s fit test coefficient of 0.886.
Regarding the relationship between the two variables of the company’s years of operation and limited access to bank credit, the results of the linear regression model show that there is a negative relationship between them. That is, if the number of years of operation of the company is large, the company has more access to credit than startups. Previous research results in the world have shown that the year of operation of the company does not affect the ability to access corporate credit. This shows that in Vietnam, the age of the company’s establishment is an important factor affecting the ability of enterprises to access bank credit. Thus, hypothesis H1 negative correlation between the number of years of operation of the company and the ability to have limited access to bank credit has been proven through the actual data from 2010 to 2012 of listed companies on the Internet. Vietnam stock market.
The results of the linear regression model show that there is a negative relationship between revenue growth and limited access to bank credit. This result is also consistent with the research results in the world as well as the reality of Vietnam’s credit. Thus, the hypothesis H2 has a negative correlation between revenue growth and limited access to bank credit.
Similarly, the results of the linear regression model show that there is a negative relationship between fixed asset growth and limited access to bank credit. Thus, the hypothesis H3 has a negative correlation between fixed asset growth and limited access to bank credit. At the same time, this result is also consistent with previous studies in the world.
Regarding the relationship between the two variables of no profit and limited access to bank credit, the results of the linear regression model show that there is a positive relationship between them. That is, if the company is operating unprofitably, the company may not be able to access credit. This is consistent with the theory of bank credit as well as the reality of Vietnam’s credit. Thus, hypothesis H4 positive correlation between no profit and limited access to bank credit has been proven.
In addition, large company size, domestic sales ratio, bank accounts, manufacturing industry, and number of competitors also negatively affect limited access to bank credit. Thus, the hypothesis H6 and H8 the negative correlation between the independent variables of large firm size, bank account and the dependent variable of restricted access to bank credit is also proved (in line with previous research results in the world).
Since the regression results show that the gender of female owners is negatively correlated with the ability to have limited access to bank credit, hypothesis H7 is rejected. Previous research results in other countries show that the gender of the owner is female does not affect the ability to access bank credit of enterprises. This shows that in Vietnam banks still highly appreciate the management ability of men.
The independent variable of firm size has the coefficient sig. >0.1, so there is no relationship with restricted access to bank credit, so hypothesis H6 is rejected. This is true of the results of studies in other countries. The fact shows that banks appreciate large-scale companies and these companies will easily access bank credit. However, if the enterprise is medium-sized, the bank will base its decision on other criteria, not underestimate these companies.
CHAPTER 3 SUMMARY
Chapter 3 has presented the research results including descriptive statistics of research variables, descriptive results of correlation coefficients, research results, regression model testing. From the regression results, it is shown that the factors affecting the enterprise’s ability to access bank credit include the number of years of operation of the company, revenue growth, fixed asset growth, unprofitability. profitability, large company size, female owner’s gender, bank account, industry, number of competitors, percentage of domestic sales.
In the next chapter, we will consider some suggestions to improve the access to bank credit of companies listed on the stock exchange of Vietnam.
CHAPTER 4
RECOMMENDATIONS TO IMPROVE THE ACCESSIBILITY TO BANK CREDIT OF ENTERPRISES LISTED ON VIETNAM Stock Market
Based on the obtained research results, a number of recommendations are made to support enterprises to obtain investment capital for production and business development, and to improve their production and business efficiency.
4.1. On the side of companies listed on Vietnam’s stock market
4.1.1.Improve production and business efficiency, increase the creditworthiness of listed companies
The results of the linear regression model show that there is a negative relationship between revenue growth and limited access to bank credit. limited access to bank credit. Regarding the relationship between the two variables no profit and limited access to bank credit, the results also show that there is a positive relationship between them. That is, if the company is operating unprofitably, the company may not be able to access credit. Similarly, the results of the linear regression model show that there is a negative relationship between fixed asset growth and limited access to bank credit.