To reduce the unobserved heterogeneity in the credit distribution mechanism, Constantine. Drakos and Nicholas Giannakopoulos (2011) introduced control variables including: (1) cash flow, (2) trade credit, and (3) number of competitors.
In addition, they also consider: (1) the rate of turnover in the domestic market, (2) the companies that are members of a business association or chamber of commerce, (3) the company's habitual frequent use of the Internet in dealing with customers and suppliers, (4) education level of the workforce. These variables may provide useful information for firms with unobserved structural characteristics, related to management quality.
The author uses probit model to study, the test results show that the higher the ability to access bank credit for: (1) companies with growth in revenue; (2) profitable company ; (3) large-scale companies; (4) the company has a relationship with the bank. Factors that do not affect credit access include age of the company, use of independent auditors, use of international auditing standards, medium-sized companies, and gender of female owners.
1.3. Current status of listed companies on Vietnam stock market
1.3.1. Overview Introduction
After more than 12 years of operation, Vietnam's stock market has made significant progress. According to the report of the State Securities Commission (SSC), the number of intermediaries on the stock market has increased from 7 securities companies and 1 fund management company to 106 securities companies and 47 management companies. fund. From 5 companies in 2000 to now, there have been nearly 600 listed companies and organizations, market capitalization accounted for 42% of GDP. In addition, banks, financial companies, securities companies, fund management companies, insurance companies, investment funds participating in the market have contributed to the formation of a system of specialized investors. industry (State Securities Commission, 2013).
In 2009, Vietnam's stock market grew strongly thanks to the government's economic stimulus policies, especially the policy of interest rate support, exemption, reduction and deferral of income tax. The high credit growth rate in 2009 contributed to growth on the one hand, but also helped the stock market rebound strongly. In addition, the decrease in inflation this year also creates more confidence about macroeconomic stability.
In 2010, due to the pressure of inflation and high interest rates, the trade deficit was high, while credit growth and money supply decreased compared to 2009, so the VNIndex decreased by 2.04%. However, Vietnam's stock market continued to achieve very positive results in important aspects: market capitalization reached 39% of GDP, an increase of 17.1% compared to 2009; actual capital mobilization reached 98.7 trillion dong, 3 times higher than 2009; average trading value per session reached 2,480 billion dong; net foreign capital inflows over 1 billion USD; the number of investor accounts increased by 38%…(State Securities Commission, 2012).
Market size compared to GDP narrowed when the market capitalization as of December 31, 2011 decreased significantly, reaching only VND 539,000 billion, down VND 187,000 billion (26%) compared to VND 726,000 billion at the end of the year. 2010. Vietnam's stock market was one of the world's biggest decliners in 2011. Vietnam's stock market is affected by and reflects macroeconomic difficulties and uncertainties such as high inflation, The banking system faced liquidity difficulties, most businesses failed to achieve the set revenue and profit targets. The downtrend clearly dominated with HNX-Index down 48.6%, VN Index down 27.5%. 62% of stocks on both exchanges have market prices below par value. Market liquidity dropped sharply with the total trading value of both exchanges in many sessions below 1,000 billion dong.The average trading value and volume per session for both HNX and HOSE (by order matching method) in 2011 was VND 790.72 billion and 53.25 million shares, down 65% and 30% compared to the previous year. (State Securities Commission, 2012).
With an increase of 40% in the first 5 months of the year and then a sharp decline in the remaining 7 months, Vietnam's stock market closed the 2012 trading year with many ups and downs and fluctuations. Despite many difficulties, 2012 still had a pretty good ending when the last session of the year (December 28, 2012) closed in green on both exchanges. VN Index closed the year at 413.73 points, up 3.76 points (equivalent to 0.92%), the total trading volume of this session reached 84,321,540 units, equivalent to 1,157,572 billion dong; HNX Index closed the year at 57.09 points, up 0.94 points (equivalent to 1.67%), the total trading volume reached 74,725,130 units, equivalent to 473,465 billion dong. For the whole year of 2012, VN Index increased a total of 62.18 points, HNX Index decreased by 1.65 points compared to the end of 2011. But compared to the peak reached by the market in May 2012,VNIndex and HNX-Index lost 74.34 points, respectively (compared to May 8, 2012) and 26.70 points (compared to May 7, 2012). The average trading size per session in 2012 reached VND 1,316 billion, up 28% compared to 2011 thanks to the extension of afternoon trading time.
Looking back at 2012, Vietnam's stock market is still quite unstable due to both objective and subjective reasons. Although there were economic bright spots recorded in 2012 such as relatively low inflation, stable exchange rate, falling interest rates, strong export growth and trade balance surplus, the trend of capital divestment of large corporations has not been confirmed. unions and corporations, plus the restructuring of not only credit institutions but also SOEs, makes it difficult for the market to see significant improvements in the medium term.
1.3.2. Business situation
Through the survey of audited financial statements of 648 enterprises listed on the Vietnam stock market from 2010 to 2012, the business situation of listed companies is as follows:
Table 1.1 Revenues of listed companies
Unit: Million VND
| STT | Industry group | 2010 | 2011 | 2012 | 2011/2010 | 2012/2011 |
| first | Communication technology | 1,375,224 | 1,401,756 | 1,164,379 | 102% | 83% |
| 2 | Professional services – Science – Technology | 111,487 | 151,353 | 177,629 | 136% | 117% |
| 3 | Support services – Waste treatment and recycling services | 160,869 | 238,345 | 256,311 | 148% | 108% |
| 4 | Accommodation and food services | 118,618 | 86.621 | 112,558 | seventy three% | 130% |
| 5 | Education and training | 2.164 | 2,007 | 3.049 | ninety three% | 152% |
| 6 | Extractive | 5.248,044 | 7,767,276 | 10,492,011 | 148% | 135% |
| 7 | Arts and entertainment services | 31,583 | 34,041 | 43,201 | 108% | 127% |
| 8 | Manufacture | 29.539,801 | 43,863,393 | 45,995,846 | 148% | 105% |
| 9 | Agriculture - Forestry - Fishery production | 674.375 | 1,811,173 | 1,507,428 | 269% | 83% |
| ten | Commercial (Wholesale and Retail) | 21,245,159 | 28,635,772 | 25,926,551 | 135% | 91% |
| 11 | Community Utilities | 4,389,290 | 6,248,219 | 25,806.795 | 142% | 413% |
| twelfth | Transportation and Warehousing | 2,097,373 | 2,735.687 | 3,418,591 | 130% | 125% |
| 13 | Construction and real estate | 6,014,263 | 6,061,796 | 5,605,817 | 101% | 92% |
| 14 | Finance and insurance | 23,398,409 | 46,186,340 | 54,303,080 | 197% | 118% |
| 15 | Other services | 141,627 | 46.763 | 252.029 | 33% | 539% |
| Add | 94,548,286 | 145,270,542 | 175,065,275 | 154% | 121% |
Maybe you are interested!
-
 Factors affecting the ability to access bank credit of enterprises listed on the stock market - 1
 -
 Factors affecting the ability to access bank credit of enterprises listed on the stock market - 2
 -
 Factors affecting the ability to access bank credit of enterprises listed on the stock market - 4
 -
 Factors affecting the ability to access bank credit of enterprises listed on the stock market - 5
 -
 Factors affecting the ability to access bank credit of enterprises listed on the stock market - 6
Source: http://www.chungkhoanphuongnam.com.vn
The above table shows that, in 2011 the revenue of listed companies had a significant growth (up 54% compared to 2010). However, in 2012, the business situation started to be difficult, revenue only increased by 21% compared to 2011. In which, the Technology - Communication and Agriculture - Forestry - Fisheries industry saw the biggest decrease in revenue. (17%), followed by Trade (wholesale and retail (down 9%), Construction and real estate (down 8%)… Particularly, the Community Utilities industry saw a significant revenue growth (down by 8%). 313%), Education and training (52%), mining, accommodation and catering services also saw significant revenue growth.
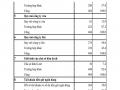
Table 1.2 Situation of profit after tax of listed companies
Unit: Million VND
| STT | Industry group | 2010 | 2011 | 2012 | 2011/2010 | 2012/2011 |
| first | Communication technology | 47,570 | 47.742 | (1,235) | 100% | -3% |
| 2 | Professional services – Science – Technology | 8,348 | 17,706 | 13.953 | 212% | 79% |
| 3 | Support services – Waste treatment and recycling services | 15,310 | 3,010 | 17,148 | 20% | 570% |
| 4 | Accommodation and food services | 9,751 | 16.518 | 15,227 | 169% | 92% |
| 5 | Education and training | 38 | 42 | ten | 111% | 24% |
| 6 | Extractive | 417.832 | 584,995 | 818,745 | 140% | 140% |
| 7 | Arts and entertainment services | 11,067 | 13.317 | 16.552 | 120% | 124% |
| 8 | Manufacture | 3,074.759 | 3,385,887 | 2,908.892 | 110% | eighty six% |
| 9 | Agriculture - Forestry - Fishery production | 199,806 | 533,282 | 405,882 | 267% | 76% |
| ten | Commercial (Wholesale and Retail) | 650,320 | 874,961 | 682,229 | 135% | 78% |
| 11 | Community Utilities | 431,219 | 604.812 | 2,821,572 | 140% | 467% |
| twelfth | Transportation and Warehousing | 107.466 | 161,928 | 201,647 | 151% | 125% |
| 13 | Construction and real estate | 1,544,256 | 1,124,295 | 433.957 | seventy three% | 39% |
| 14 | Finance and insurance | 4,525,713 | 5,422.797 | 6,941,412 | 120% | 128% |
| 15 | Other services | 2.929 | 3.011 | 4.234 | 103% | 141% |
| Add | 11,046,384 | 12,794,303 | 15,280,225 | 116% | 119% |
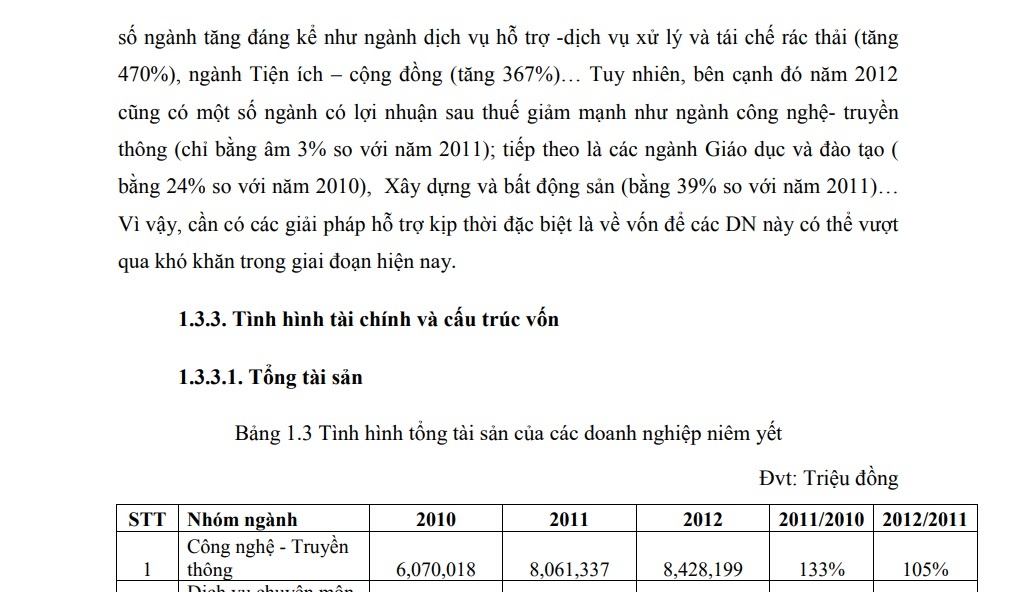
In terms of production and business efficiency, enterprises listed on Vietnam's stock market have increased efficiency gradually from 2010 to 2012 (in 2011 increased by 16% compared to 2010; in 2012 increased by 19% compared to 2011). In which, profit after tax in 2012 compared to 2011 of a number of industries increased significantly such as supporting services - waste treatment and recycling services (up 470%), utilities - community (up 367%). %)… However, in 2012 there were also a number of industries with a sharp decrease in profit after tax such as the technology-communication industry (only negative 3% compared to 2011); followed by Education and Training (24% compared to 2010), Construction and real estate (39% compared to 2011)… Therefore, special timely support solutions are needed. is about capital so that these enterprises can overcome difficulties in the current period.
1.3.3. Financial situation and capital structure
1.3.3.1. Total Assets Table
1.3 Situation of total assets of listed companies
Unit: Million VND
| STT | Industry group | 2010 | 2011 | 2012 | 2011/2010 | 2012/2011 |
| first | Technology - Media information | 6,070,018 | 8,061,337 | 8,428,199 | 133% | 105% |
| 2 | Professional services - Science - Technology Art | 396.255 | 702.235 | 919.993 | 177% | 131% |
| 3 | Support services – Waste treatment and recycling services | 505,470 | 822.848 | 737,428 | 163% | 90% |
| 4 | Lodging and dining drink | 463.073 | 543,369 | 586.501 | 117% | 108% |
| 5 | Education and training | 66.284 | 89,079 | 88,650 | 134% | 100% |
| 6 | Extractive | 32,030,070 | 42,340,688 | 54,012,112 | 132% | 128% |
| 7 | Arts and entertainment services | – | 122.007 | 126,408 | 104% | |
| 8 | Manufacture | 111,979,875 | 154,658,669 | 193,690,503 | 138% | 125% |
| 9 | Agriculture - Forestry - Fishery production | 4,746,204 | 6,759,829 | 7,971,610 | 142% | 118% |
| ten | Commercial (Wholesale and Retail) | 28,552,745 | 41,968,828 | 46,648,311 | 147% | 111% |
| 11 | Community Utilities | 25,669,866 | 29,289,910 | 83.418,411 | 114% | 285% |
| twelfth | Transportation and Warehousing | 23,603.907 | 20,881,768 | 22,737.804 | 88% | 109% |
| 13 | Construction and real estate | 66,668,188 | 103,326,970 | 117,341,632 | 155% | 114% |
| 14 | Finance and insurance | 1,022,954.655 | 1,476,008,903 | 1,784,079,832 | 144% | 121% |
| 15 | Other services | – | 1,661,165 | 2,699,229 | 162% | |
| Add | 1,323,706,610 | 1,887,237,605 | 2,323,486.623 | 143% | 123% |
Source: http://www.chungkhoanphuongnam.com.vn
In 2012, the consolidated report on total assets of 648 enterprises listed on the Vietnam stock market was VND 2,323,486,623 million, an increase of 23% compared to 2011. In which, total assets of a number of industries in 2012 compared to 2011. 2011 increased sharply such as: Community utilities (up 185%), other services (up 62%), professional - scientific - technical services (up 31%). Particularly, the supporting services - waste treatment and recycling services in 2012 had a 10% decrease in total assets compared to 2011.
In the structure of assets, the average proportion of fixed assets in 2012 was 44.9%. Depending on the specific characteristics of each industry group, the proportion of fixed assets will vary between industry groups, specifically the order of the proportion of fixed assets from low to high is as follows: Arts and entertainment services (accounting for 14.3% of total assets), Trade (accounting for 29.2% of total assets), Professional services - Science - Technology (accounting for 31.3% of total assets), Support services – Waste treatment and recycling services (accounting for 34.9% of total assets), Construction and real estate (accounting for 40.7% of total assets), Technology - Communication (accounting for 46.1). % of total assets), Production (accounting for 47.8% of total assets), Agriculture - Forestry - Fishery (accounting for 51.0% of total assets), Community utilities (accounting for 52.5 % of total assets), Mining (accounting for 57.0% of total assets),Transportation and warehousing (accounting for 61.7% of total assets), Education and training (accounting for 68.1% of total assets), Accommodation and catering services (accounting for 78.3% of total assets). produce).
1.3.3.2. Capital
- Equity
Table 1.4 Equity situation of listed companies
Unit: Million VND
| STT | Industry group | 2010 | 2011 | 2012 | 2011/2010 | 2012/2011 |
| first | Technology - Media information | 2,457.832 | 3,337,838 | 3,319,494 | 136% | 99% |
| 2 | Professional services – Science – Technology | 237,940 | 354,777 | 482.927 | 149% | 136% |
| 3 | Support Services - Services for treatment and recycling of waste | 272,857 | 415,851 | 412.794 | 152% | 99% |
| 4 | Lodging and dining drink | 262,894 | 407,005 | 412.223 | 155% | 101% |
| 5 | Education and training | 61,174 | 86,949 | 86.785 | 142% | 100% |
| 6 | Extractive | 10,936.639 | 15,094,305 | 18,134,776 | 138% | 120% |
| 7 | Arts and entertainment services | – | 115,280 | 112.354 | 97% | |
| 8 | Manufacture | 57,701,830 | 74,496,663 | 85,882,588 | 129% | 115% |
| 9 | Agriculture - Forestry - Fishery production | 3,418,904 | 4,705,834 | 6,056,820 | 138% | 129% |
| ten | Commercial (Wholesale and Retail) | 9,589,964 | 13,148,664 | 15,304,545 | 137% | 116% |
| 11 | Community Utilities | 11,610,692 | 12,709,087 | 38,632,340 | 109% | 304% |
| twelfth | Transportation and Warehousing | 8,880,264 | 8,861,495 | 9,891,428 | 100% | 112% |
| 13 | Construction and Real Estate | 30,088.296 | 45,668,376 | 46,848,748 | 152% | 103% |
| 14 | Finance and insurance | 111,084,270 | 147,134,303 | 189,658,359 | 132% | 129% |
| 15 | Other services | – | 182,823 | 184.317 | 101% | |
| Add | 246,603.556 | 326,719,250 | 415,420,498 | 132% | 127% |
Source: http://www.chungkhoanphuongnam.com.vn
In 2012, the total equity of all enterprises listed on the stock exchange of Vietnam was 415,420,498 million, up 27% compared to 2011. If compared to 2010, the equity increased by 80,115,694 million VND (equivalent to 18%). Owner's equity of 648 listed enterprises annually increased mainly from profit after tax.
Some industries have low equity/total capital ratios such as: Other services (7%), finance and insurance (11%), commerce (wholesale and retail) (33%). The rest of the industries have relatively high equity/total capital ratios.
- Liabilities must pay
Table 1.5 Liabilities of listed companies
Unit: Million VND
| STT | Industry group | 2010 | 2011 | 2012 | 2011/2010 | 2012/2011 |
| first | Technology - Media information | 3,580,104 | 4,610,962 | 4,924.631 | 129% | 107% |
| 2 | Professional services - Science - Technology Art | 158.315 | 332,223 | 417,448 | 210% | 126% |
| 3 | Support services – Waste treatment and recycling services | 232,103 | 393,881 | 318,721 | 170% | 81% |
| 4 | Lodging and dining drink | 200,179 | 136,365 | 174.278 | 68% | 128% |
| 5 | Education and training | 5.110 | 2.130 | 1.865 | 42% | 88% |
| 6 | Extractive | 20,951,885 | 26,955,959 | 34,082,525 | 129% | 126% |
| 7 | Arts and entertainment services | – | 6,727 | 14,054 | 209% | |
| 8 | Manufacture | 53,113,255 | 75,342,523 | 100,721.849 | 142% | 134% |
| 9 | Agriculture - Forestry - Fishery production | 1,309,931 | 2,004.817 | 1,860,762 | 153% | ninety three% |
| ten | Commercial (Wholesale and Retail) | 17,853,857 | 27,178,061 | 30,099,745 | 152% | 111% |
| 11 | Community Utilities | 14,031,722 | 16,295,546 | 42,676,878 | 116% | 262% |
| twelfth | Transportation and Warehousing | 10,966.224 | 11,077,325 | 11,836,586 | 101% | 107% |
| 13 | Construction and real estate | 35,135,545 | 54,459,851 | 67,755,887 | 155% | 124% |
| 14 | Finance and insurance | 901,067,276 | 1,325,622,269 | 1,591,286,420 | 147% | 120% |
| 15 | Other services | – | 1,478,343 | 2,514,912 | 170% | |
| Add | 1,058,605,506 | 1,545,896,982 | 1,888,686,561 | 146% | 122% |
Source: http://www.chungkhoanphuongnam.com.vn