PHỤ LỤC 5
Kết quả phân tích hồi quy
5.1. Ma trận hệ số tương quan giữa các biến
Correlations
II | IM | IS | IC | LP | EF | ||
II | Pearson Correlation | 1 | .597** | .597** | .537** | .481** | .419** |
Sig. (2-tailed) | .000 | .000 | .000 | .000 | .000 | ||
N | 298 | 298 | 298 | 298 | 298 | 298 | |
IM | Pearson Correlation | .597** | 1 | .484** | .387** | .461** | .466** |
Sig. (2-tailed) | .000 | .000 | .000 | .000 | .000 | ||
N | 298 | 298 | 298 | 298 | 298 | 298 | |
IS | Pearson Correlation | .597** | .484** | 1 | .616** | .473** | .398** |
Sig. (2-tailed) | .000 | .000 | .000 | .000 | .000 | ||
N | 298 | 298 | 298 | 298 | 298 | 298 | |
IC | Pearson Correlation | .537** | .387** | .616** | 1 | .478** | .359** |
Sig. (2-tailed) | .000 | .000 | .000 | .000 | .000 | ||
N | 298 | 298 | 298 | 298 | 298 | 298 | |
LP | Pearson Correlation | .481** | .461** | .473** | .478** | 1 | .565** |
Sig. (2-tailed) | .000 | .000 | .000 | .000 | .000 | ||
N | 298 | 298 | 298 | 298 | 298 | 298 | |
EF | Pearson Correlation | .419** | .466** | .398** | .359** | .565** | 1 |
Sig. (2-tailed) | .000 | .000 | .000 | .000 | .000 | ||
N | 298 | 298 | 298 | 298 | 298 | 298 |
Có thể bạn quan tâm!
-

 Hạn Chế Của Đề Tài Và Hướng Nghiên Cứu Tiếp Theo
 -
 Loại Hình Sở Hữu Của Ngân Hàng Nơi Anh/chị Đang Làm Việc:
 -
 Ảnh hưởng của lãnh đạo mới về chất đến ý thức gắn kết tổ chức của nhân viên trong các ngân hàng tại Tp.HCM - 12
Xem toàn bộ 104 trang tài liệu này.
**. Correlation is significant at the 0.01 level (2-tailed).
5.2. Kết quả phân tích mô hình hồi quy thứ nhất
Descriptive Statistics
Mean | Std. Deviation | N | |
LP | 3.1404 | .80121 | 298 |
II | 3.5659 | .61632 | 298 |
IM | 3.5361 | .68454 | 298 |
IS | 3.4958 | .63247 | 298 |
IC | 3.2710 | .77997 | 298 |
Correlations
LP | II | IM | IS | IC | ||
Pearson Correlation | LP | 1.000 | .481 | .461 | .473 | .478 |
II | .481 | 1.000 | .597 | .597 | .537 | |
IM | .461 | .597 | 1.000 | .484 | .387 | |
IS | .473 | .597 | .484 | 1.000 | .616 | |
IC | .478 | .537 | .387 | .616 | 1.000 | |
Sig. (1-tailed) | LP | . | .000 | .000 | .000 | .000 |
II | .000 | . | .000 | .000 | .000 | |
IM | .000 | .000 | . | .000 | .000 | |
IS | .000 | .000 | .000 | . | .000 | |
IC | .000 | .000 | .000 | .000 | . | |
N | LP | 298 | 298 | 298 | 298 | 298 |
II | 298 | 298 | 298 | 298 | 298 | |
IM | 298 | 298 | 298 | 298 | 298 | |
IS | 298 | 298 | 298 | 298 | 298 | |
IC | 298 | 298 | 298 | 298 | 298 |
Variables Entered/Removedb
Variables Entered | Variables Removed | Method | |
1 | IC, IM, IS, IIa | . | Enter |
a. All requested variables entered.
b. Dependent Variable: LP
Model Summaryb
R | R Square | Adjusted R Square | Std. Error of the Estimate | Durbin-Watson | |
1 | .588a | .346 | .337 | .65231 | 1.831 |
a. Predictors: (Constant), IC, IM, IS, II
b. Dependent Variable: LP
ANOVAb
Sum of Squares | df | Mean Square | F | Sig. | ||
1 | Regression | 65.982 | 4 | 16.496 | 38.767 | .000a |
Residual | 124.673 | 293 | .426 | |||
Total | 190.655 | 297 |
a. Predictors: (Constant), IC, IM, IS, II
b. Dependent Variable: LP
Coefficientsa
Unstandardized Coefficients | Standardized Coefficients | t | Sig. | Collinearity Statistics | ||||
B | Std. Error | Beta | Tolerance | VIF | ||||
1 | (Constant) | .177 | .251 | .704 | .482 | |||
II | .187 | .088 | .143 | 2.127 | .034 | .490 | 2.039 | |
IM | .256 | .070 | .219 | 3.644 | .000 | .618 | 1.618 | |
IS | .178 | .084 | .140 | 2.113 | .035 | .506 | 1.977 | |
IC | .236 | .064 | .229 | 3.686 | .000 | .576 | 1.736 |
a. Dependent Variable: LP
Histogram
Dependent Variable: LP
Normal P-P Plot of Regression Standardized Residual
Dependent Variable: LP
Mean =-1.3IE-15
Regression Standardized Residual
ObservedCumProb
0
0
S catterplot
0’
Regression Standardized Residual
Dependent Variable : LP
0 00
0
0
0
0 00 ’
0
0
0
Fte gression Standardize d Pre dicted Value
0 0
0
5.3. Kết quả phân tích mô hình hồi quy thứ hai
Descriptive Statistics
Mean | Std. Deviation | N | |
EF | 3.7975 | .74838 | 298 |
II | 3.5659 | .61632 | 298 |
IM | 3.5361 | .68454 | 298 |
IS | 3.4958 | .63247 | 298 |
IC | 3.2710 | .77997 | 298 |
Correlations
EF | II | IM | IS | IC | ||
Pearson Correlation | EF | 1.000 | .419 | .466 | .398 | .359 |
II | .419 | 1.000 | .597 | .597 | .537 | |
IM | .466 | .597 | 1.000 | .484 | .387 | |
IS | .398 | .597 | .484 | 1.000 | .616 | |
IC | .359 | .537 | .387 | .616 | 1.000 | |
Sig. (1-tailed) | EF | . | .000 | .000 | .000 | .000 |
II | .000 | . | .000 | .000 | .000 | |
IM | .000 | .000 | . | .000 | .000 | |
IS | .000 | .000 | .000 | . | .000 | |
IC | .000 | .000 | .000 | .000 | . | |
N | EF | 298 | 298 | 298 | 298 | 298 |
II | 298 | 298 | 298 | 298 | 298 | |
IM | 298 | 298 | 298 | 298 | 298 | |
IS | 298 | 298 | 298 | 298 | 298 | |
IC | 298 | 298 | 298 | 298 | 298 |
Variables Entered/Removedb
Variables Entered | Variables Removed | Method | |
1 | IC, IM, IS, IIa | . | Enter |
a. All requested variables entered.
b. Dependent Variable: EF
Model Summaryb
R | R Square | Adjusted R Square | Std. Error of the Estimate | Durbin-Watson | |
1 | .522a | .273 | .263 | .64259 | 1.979 |
a. Predictors: (Constant), IC, IM, IS, II
b. Dependent Variable: EF
ANOVAb
Sum of Squares | df | Mean Square | F | Sig. | ||
1 | Regression | 45.354 | 4 | 11.339 | 27.459 | .000a |
Residual | 120.986 | 293 | .413 | |||
Total | 166.340 | 297 |
a. Predictors: (Constant), IC, IM, IS, II
b. Dependent Variable: EF
Coefficientsa
Unstandardized Coefficients | Standardized Coefficients | t | Sig. | Collinearity Statistics | ||||
B | Std. Error | Beta | Tolerance | VIF | ||||
1 | (Constant) | 1.324 | .247 | 5.359 | .000 | |||
II | .131 | .086 | .108 | 1.521 | .129 | .490 | 2.039 | |
IM | .328 | .069 | .300 | 4.730 | .000 | .618 | 1.618 | |
IS | .143 | .083 | .120 | 1.719 | .087 | .506 | 1.977 | |
IC | .106 | .063 | .111 | 1.687 | .093 | .576 | 1.736 |
a. Dependent Variable: EF
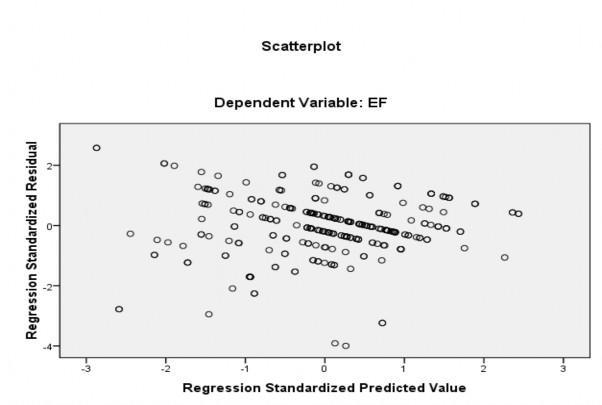
Histogram
Dependent Variable: EF
![]()
Regression Standardized Residual
Normal P-P Plot of Regression Standardized Residual
Dependent Variable: EF
Observed Cum Prob