Fitch is rated as one of the leading credit rating agencies in the world, with headquarters in New York and London. Fitch is the smallest credit rating agency among the three credit rating agencies. The company holds only a small market share in credit rating activities compared to Standard & Poor’s and Moody’s. For credit rating, Fitch ratings uses the same rating system as Standard& Poor’s, shown in Table 1.1 (Page 14).

1.2.2 Edward I. Altman . Enterprise Credit Score Model
Separate financial indicators often used in credit scoring cannot accurately predict the likely trend of financial difficulties of enterprises because they depend on individual perceptions.
In order to increase the accuracy when predicting the risk of default of enterprises in credit scoring models, commercial banks can use multivariate forecasting models. There are many methods to predict the risk of default of enterprises that have been developed and published. However, few methods are as thoroughly tested and widely accepted as Altman’s Z-score statistic function, also known as the Z-score.
The Z-index was developed by Edward I. Altman (1968), New York University. Later it was further developed by Steele (1984), Morris (1997) and other researchers. The general form of the model is Z=c+∑ciri (where: c is the number row, ri are the financial ratios and non-financial indicators used as variables, ci are the coefficients of each variable. number in the model). The Z-Index is the world’s most widely used, recognized and used tool by both academia and practice. This index is based on statistical methods with multifactorial discriminant analysis (MDA).
Z-index includes 5 ratios of X1, X2, X3, X4, X5:
X1= Working capital / Total assets
- Measure the proportion of a company’s net current assets in total assets.
- Working capital = current assets – current liabilities
- Losses in business activities will reduce the ratio X1
X2 = Retained earnings / Total assets
Maybe you are interested!
-
 Completing the credit rating system of corporate customers at Lien Viet Post Commercial Joint Stock Bank - 1
 -
 Completing the credit rating system of corporate customers at Lien Viet Post Commercial Joint Stock Bank - 2
 -
 The Role Of Credit Rating S In Risk Management
 -
 Lessons From Experience In Credit Relationship For Lienvietpostbank
 -
 Scoring Model Of Corporate Credit Society At Lienvietpostbank’S Branch
 -
 Second Case Study: The Enterprise Is Classified As Bbb And Has Incurred Overdue Debt
- This ratio measures retained earnings accumulated over time.
- The company’s maturity is also assessed by this ratio. Start-ups often have this ratio low because they have not had time to accumulate profits. According to a study by Dun & Bradstreet (1993), about 50% of bankrupt companies only operate for 5 years.
X3= EBIT / Total Assets
- A company’s survival and solvency are ultimately based on its ability to generate profits from its assets. Therefore, this ratio, according to Atlman, is a better representation of profitability measures.
X4 = Market price of equity / Book value of debt
- Debt = short-term debt + long-term debt
- Share capital = common shares + preferred shares
- This ratio shows how many times the value of a company’s assets decreased before the company fell into insolvency. This is a modified version of one of the variables used by Fisher when studying bond returns (1959). If this ratio is less than 1/3, the probability of the company going bankrupt is very high.
- For companies that have not been equitized, the market value is replaced by the book value of the share capital.
X5 = Net Sales / Total Assets
- Measure the company’s management ability to generate revenue against the competitive pressure of other competitors.
- This ratio has the lowest significance level in the model but it is an important ratio because it helps to improve the discriminant ability of the model.
- X5 varies across a wide range for different industries and different countries.
Some studies in the 1960s showed that the cash flow to debt ratio is a very good ratio for forecasting, but because during this period, the data on cash flows and depreciation of businesses are inconsistent, so the ratio is not consistent. Altman’s Z does not include cash-flow related ratios. This is quite consistent with the current situation of financial information of Vietnamese enterprises, moreover the Z-index has been used effectively in the US (95% accurate forecast for the data sample) and many other countries. Otherwise, it will probably also perform well in Vietnam in the field of credit rating or bankruptcy prediction.
From an initial Z index, Altman further developed Z’ and Z” to be applicable to each type of business:
For equitized enterprises, manufacturing industry:
Z = 1.2X1 + 1.4X2 + 3.3X3 + 0.64X4 + 0.999X5
- If Z > 2.99: The business is in a safe zone, not in danger of bankruptcy yet
- If 1.8 < Z < 2.99: Enterprise is in the warning zone, may be at risk of bankruptcy
- If Z < 1.8: Enterprise is located in a dangerous area, the risk of bankruptcy is high.
For enterprises that have not been equitized, the manufacturing industry:
Z’ = 0.717X1 + 0.847X2 + 3.107X3 + 0.42X4 + 0.998X5
- If Z’ > 2.9: The business is in a safe zone, not in danger of bankruptcy yet
- If 1.23 < Z’ < 2.9: Enterprise is in the warning area, may be at risk of bankruptcy
- If Z’ < 1.23: Enterprise is in danger zone, high risk of bankruptcy.
For other businesses:
The Z-index” below can be used for most industries and types of businesses. Because of the large variation of X5 between industries, X5 is omitted.
Z” = 6.56X1 + 3.26X2 + 6.72X3 + 1.05X4
- If Z” > 2.6: The business is in a safe zone, not in danger of bankruptcy yet
- If 1.1 < Z” < 2.6: Enterprise is in the warning zone, may be at risk of bankruptcy
- If Z” <1.1: The enterprise is located in a dangerous area, the risk of bankruptcy is high.
The higher the Z index (or Z’ and Z”), the lower the probability that the borrower will default. To increase this index requires improving management capacity, reviewing to reduce inactive assets, saving reasonable costs, and building brands. It is the indirect combination of many financial and non-financial factors in the new model called the index of safety.
1.2.3 Similarities Between Edward I. Altman’s Credit Score Model and Standard & Poor’s Credit Rating
In addition to warning signs of bankruptcy, Altman studied over 700 companies to come up with an adjusted “Z” index:
Z”adjustment = 3.25 + Z” = 3.25 + 6.56X1 + 3.26X2 + 6.72X3 + 1.05X4
Adjusted Z” is quite similar to the S&P bond ratings. The implication is that the mathematical models are comparable to the expert method.
Table 1.3: Correlation between Altman’s adjusted Z index and S&P . rating notation
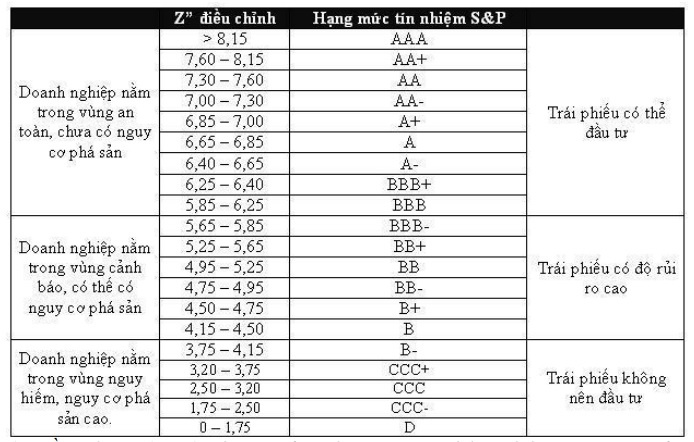
(Source: Altman (2003), The use of Credit scoring Models and the Importance of a Credit Culture, New York University. Lam Minh Chanh (2007), “Using the Z-score to estimate the Credit Score”)
1.3 Experience in corporate credit rating of some commercial banks in Vietnam
In risk management, commercial banks mainly use the credit system to evaluate customers. However, in some cases, commercial banks also need to refer to the published credit rating information of commercial banks and domestic auditing organizations, especially for customers who have credit relationships with many other banks. together.
1.3.1 Credit rating system of CIC
The Credit Information Center of the State Bank of Vietnam (CIC) conducts corporate credit rating under the guidance of the State Bank of Vietnam in order to standardize the assessment of financial indicators applicable to domestic commercial banks. CIC is currently using eleven financial indicators to score according to the guidance in Decision No. 57/2002/QD-NHNN dated 24/01/2002 of the State Bank. This model also has limitations due to limitations in updating financial data by industry, lack of synchronous and complete assessment of financial and non-financial indicators according to current international standards.
1.3.2 Vietinbank’s credit rating system
The system of financial indicators evaluated in Vietinbank’s credit model is based on the guidance of the State Bank and has some adjustments to the industry statistical coefficients according to calculations from Vietinbank’s credit information system data.
Normally, each financial indicator in Vietinbank’s credit system has five standard ranges, corresponding to five points ranging from 20 to 100 (initial points). And each group of non-financial indicators is also classified into five levels as above, but in each group of non-financial indicators, there are five groups of detailed indicators with two scales of 4, 8, 12, 16, 20 and 2. , 4, 6, 8, 10 (initial points). The total score obtained after multiplying the original score with the weight will be the result to classify the DN.
The corporate credit model at Vietinbank includes 11 financial indicators, divided into 4 groups of industries and 3 levels of business size. Groups of non-financial indicators in the evaluation model have different weights between SOEs, foreign-invested enterprises and other enterprises, including: Cash flow, management experience capacity, transaction reputation with the bank, including credit and non-credit relationships, business environment, and other operating characteristics.
Table 1.4: Weighted scores of financial and non-financial indicators to score Vietinbank’s corporate credit
| Financial information is not audited | Audited financial information | |
| Non-financial indicators | 60% | 45% |
| Financial indicators | 40% | 55% |
(The source: Vietinbank)
In order to calculate the final score, Vietinbank’s credit society also classifies enterprises into two categories: audited enterprises and unaudited enterprises as shown in Table 1.4. Rating results are classified into ten levels according to the descending symbology from AA+ to C.
The corporate credit scoring model focuses on financial indicators with relatively large weights. However, the proportions of financial and non-financial expenditures are still similar with the deviation not too large.
1.3.3 Vietcombank’s credit rating system
Joint Stock Commercial Bank for Foreign Trade of Vietnam (Vietcombank) builds a credit society system on the principle of minimizing the subjective influence of non-financial indicators by designing non-financial indicators and providing cost guidance. details for the evaluation and scoring of the criteria. This is one of the leading commercial banks in Vietnam in applying debt classification according to Article 7 of Decision 493/2005/QD-NHNN.
The financial indicators are evaluated according to the guiding framework of the State Bank of Vietnam and some industry statistics are adjusted according to the calculation from the credit information data of Vietcombank. The assessed financial indicators have ten standard ranges, corresponding to five points of 10, 20 to 100 (initial score), and non-financial indicators have five standard ranges corresponding to five score levels. 20, 40, 60, 80, 100 (initial score), in general, the scale of Vietcombank’s financial indicators has a clearer separation.
Enterprises are classified into three groups: ordinary enterprises, newly established enterprises and potential enterprises to clearly define the purpose of credit construction for that enterprise. In which, the size for ordinary enterprises is four groups of large, medium, small and micro-sized, in which the micro-scale is evaluated on a separate scale with the remaining groups.
Normal businesses will be scored according to a system of 4 groups of financial indicators corresponding to fifty-two industry groups. The group of financial indicators includes: liquidity indicators group (Current solvency, Quick solvency, Instant solvency), group of operational indicators (Working capital turnover, Turnover turnover). inventory, Receivables turnover, Fixed asset utilization efficiency), balance sheet group (Total liabilities/total assets, Long-term debt/equity) and revenue target group Income (Gross profit/net sales, Profit after tax/net sales, Profit after tax/equity, Profit after tax/Average total assets, Profit before tax and interest/interest) must return).
The system of non-financial indicators includes more than 40 evaluation criteria belonging to five groups as presented in Table 1.5.
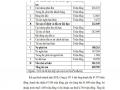
Table 1.5: Weighted scores of non-financial indicators scoring Vietcombank’s corporate credit rating
| Target group | DNNN | Enterprises with foreign investment | Other enterprises | ||
| Enterprises with investment capital in the OECD | Other foreign-invested enterprises | Public joint stock company | Other enterprises | ||
| Assess the customer’s ability to repay | 6% | 7% | 5% | 6% | 5% |
| Management qualifications and internal environment | 15% | 10% | 13% | 11% | 15% |
| Relationship with the bank | 50% | 50% | 50% | 50% | 50% |
| Factors affecting the industry | 8% | 8% | 8% | 8% | 8% |
| Factors affecting business performance | 21% | 25% | 24% | 25% | 22% |
(Source: Joint Stock Commercial Bank for Foreign Trade of Vietnam)
Vietcombank’s credit system also classifies enterprises into three main groups, namely state-owned enterprises, foreign-invested enterprises (within and outside the OECD) and other enterprises to calculate weighted non-financial indicators. . In addition, Vietcombank also classified enterprises into two categories: audited and unaudited enterprises for ordinary enterprises and micro enterprises as shown in Table 1.6.
Table 1.6: Weighted scores of financial and non-financial indicators scoring Vietcombank’s credit rating
| Business normal business | ||
| Economic information not audited | Financial information is audit | |
| Financial indicators section main | 30% | 35% |
| Non-financial indicators section main | 65% | 65% |
| Micro enterprises | Economic information not audited | Financial information is audit |
| Financial indicators section main | 25% | 30% |
| Non-financial indicators section main | 70% | 70% |
(Source: Joint Stock Commercial Bank for Foreign Trade of Vietnam)
Based on the total score obtained multiplied by the weights as mentioned above, enterprises are classified into 16 groups, decreasing from AAA to D as shown in Table 1.7.
Table 1.7: Vietcombank’s corporate rating system
| Total score | Ranking rank | Faces type of risk |
| 94-100 | AAA | Very low risk |
| 88-93.9 | AA+ | Very low risk |
| 83-87.9 | AA | Relatively low risk |
| 78-82.9 | A+ | Relatively low risk |
| 73-77.9 | A | Relatively low risk |
| 70-72.9 | BBB | Low Risk |
| 67-69.9 | BB+ | Low Risk |
| 64-66,9 | BB | Low Risk |
| 62-63.9 | B+ | Low Risk |
| 60-61.9 | B | Medium Risk |
| 58-59.9 | CCC | Medium Risk |
| 54-57.9 | CC+ | Medium Risk |
| 51-53.9 | CC | Medium Risk |
| 48-50.9 | C+ | Medium Risk |
| 45-47.9 | C | High Risk |
| Under 45 | D | Very high risk |
1.3.4 Credit rating system of ACB
Through the consulting program of Ernst & Young Vietnam Co., Ltd (E&Y), Asia Commercial Joint Stock Bank (ACB) has also gradually improved its credit system according to the principle of minimizing credit risk in its portfolio of loans. bank credit.
ACB is piloting the application of debt classification according to Article 7 of Decision 493/2005/QD-NHNN, and estimating credit risk provisions according to international standards IAS39. These system improvements help ACB classify loans and provision more accurately and move closer to international standards.
The system of financial and non-financial indicators was developed by ACB, including two parts: Scoring system for approval and Scoring system for debt classification (after lending and periodically for 3 months). month/time).
The evaluation of financial factors is based on a quantitative method through analysis of the latest year’s financial statements, and the financial indicators to be considered include: Group of liquidity indicators, Group of performance indicators, Group of financial indicators. Debt ratio, Income target group. Non-financial indicators assessed by qualitative and quantitative methods have five standard ranges, corresponding to five points of 20, 40, 60, 80, 100; The proportion for each indicator varies depending on the size and industry of the enterprise.