CHAPTER 3
MATERIALS AND RESEARCH METHODS
3.1 Time and location
Maybe you are interested!
-
 Absolute growth rate of experimental chickens over weeks of age
 -
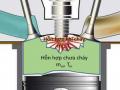 Basic Burn Rate Experimental Formulas
 -
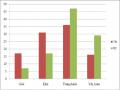 Compare Test Scores Between the Experimental Class and the Control Class
 -
 Interview Questions on Knowledge, Attitudes, and Practices in Worm Infection Prevention.
 -
 Nutrition for Experimental Calves After Supplementation of Ta Tinh Compared with Control Group and Feed Requirements
Time: October 2009 – December 2010
Location: Faculty of Aquaculture - Can Tho University
3.2 Research materials
Laboratory tools and equipment: Microscope, electronic balance, slide, measuring tube, plastic dropper, pipette, syringe, mask, gloves, conical flask, heat-resistant bottle, inoculating stick, alcohol lamp, oil pen, alcohol spray bottle, surgical kit, petri dish, test tube, aluminum tray.
Heating stirring stove, sterile incubator, refrigerated centrifuge, refrigerator, incubator, incubator, sterilizer, pH titrator. pH, temperature, and oxygen are measured by thermometer and test kit.
Experimental tank: 250 liter plastic, 2 m3 composite tank
Chemicals: NaCl, Na 2 SO 4 , Na 2 HPO 4 .2H 2 O, NaH 2 PO 4 .2H 2 O, KH 2 PO 4 , Formaline (37%), Methyl violet, distilled water, Methanol, Glycerol, Wright&Giemsa solution, Nitric acid, TSA medium, NB, burning alcohol, 70 0 C alcohol.
The experimental pangasius source was purchased from a fish hatchery in Can Tho City.
Astragalus extract (40% polysaccharide) produced by Xuancheng Baicao, China.
E. ictaluri CAF 258 bacteria source from the bacterial collection of the Department of Aquatic Biology and Pathology, Faculty of Aquaculture, Can Tho University.
3.3 Research methods
3.3.1 Bacterial recovery and enrichment
The experimental bacterial strain was recovered on TSA medium. After 48 hours, the shape and color of the colonies were observed and Gram stained to check the purity of the isolated bacterial strain. Then, it was cultured in BHI medium to prepare for the LD 50 determination experiment and the infection experiment.
3.3.2 Experiment to determine LD 50 Experiment preparation
Experimental catfish weighing 20-25g after purchase were raised in a tank with a volume of 1m3 , with aeration and fed daily until the fish ate regularly, then the experiment was conducted. Before setting up the experiment, the fish were checked for parasites and bacteria to select healthy fish.
Preparation of infectious bacteria
Bacteria were grown in 200ml of BHI medium and incubated overnight at 28-30 0 C on a shaker at 180 rpm. Then the bacteria were put into a sterile falcon tube (50ml) and centrifuged at 5,000 rpm for 10 minutes at 4 0 C to collect the bacteria. The bacteria were washed with saline (0.9% NaCl) 3 times and the bacterial density was counted using a spectrophotometer at a wavelength of 610nm (OD=1±0.1≈10 9 CFU/ml) then the bacterial solution was diluted 10 times to obtain the experimental densities of 10 3 , 10 4 , 10 5 ,
10 6 . Bacterial density was also determined by adding 20 µl (repeated 6 times) of the solution.
Adjusted bacterial concentration onto TSA plate and incubate at 28-30 0 C then count the average number of colonies after 24-48 hours.
Experimental setup
The experiment was completely randomized with 5 treatments at concentrations of 10 3 , 10 4 , 10 5 , 10 6 and a control treatment without bacterial injection, each treatment was repeated 3 times with a density of 10 fish/tank. Fish were injected (0.1 ml of bacteria/fish) at the base of the thorax. The density of E. ictaluri bacteria injected for the experiment was: 2.8x10 3 , 5.4x10 4 , 5x10 5 , 0.8x10 6 . After injection, the fish's symptoms were monitored and the number of dead fish was recorded continuously for 14 days. LD 50 was determined according to the method of Reed and Muench (1938).
LD 50 = the level causing the lowest 50% infection rate in fish - interpolated number (pd) pd = (L%-50)(L%-H%)
In there:
L%: lowest rate of infected fish above 50% H%: highest rate of infected fish below 50%
3.3.3 Herbal feeding experiment.
The experiment was completely randomized with 6 treatments and 3 replications carried out in 5 weeks. Treatment 1 (NT1) fed feed (TĂ) without Astragalus (HK) supplementation, treatment 2 (NT2) fed feed supplemented with Astragalus, treatment 3 (NT3) fed feed without Astragalus supplementation but
vaccinated at week 3, treatment 4 (NT4) fed food supplemented with Astragalus and vaccinated at week 3, treatment 5 (NT5) fed unsupplemented food, treatment 6 (NT6) fed food supplemented with Astragalus.
3.3.4 Experiment to induce infection after 5 weeks of feeding herbs.
After 5 weeks of feeding herbs , E. ictaluri bacteria were infected in fish.
treatments 2, 3, 4 and 5, except treatment 6, which was injected with NaCl.
The vaccine was prepared from a highly virulent strain of E. ictaluri by disrupting bacterial cells with 4% formalin for 24 hours. The vaccine was injected at a dose of 0.1ml/fish, with a concentration of 10 5.17 cfu/ml. The duration of the vaccine's effect was 3 weeks. Then, the fish were infected with pathogenic E. ictaluri strains through the results of the LD 50 experiment . After injecting the above bacterial strains into the experimental tanks except for the control tank injected with physiological saline, the fish were continuously monitored for 1 week. To accurately assess the protective ability of the vaccine, before the experiment ended, re-isolation of the surviving fish was conducted to determine the attack of the virulent bacterial strains (Dang Thi Hoang Oanh et al ., 2002). The indicators
The recorded criteria include: (1) signs of liver pus disease in fish; (2) number of dead fish and time of death.
3.3.3 Determine the effectiveness of herbal extracts on the resistance to liver pus disease in pangasius fish through indicators.
Fish from experimental treatments were collected and blood was drawn to study the indicators.
assessment of fish immunity.
3.3.3.1 Determination of hematological parameters
Red blood cell counting method
The number of red blood cells was determined quantitatively according to the method of Supranee et al . (1991)
Put 10 µl of blood into a plastic tube containing 1990 µl of Natt&Herrick solution. Shake the test tube gently, evenly, and quickly to avoid blood clotting. The red blood cell density will be determined by the red blood cell counting chamber through observation under an optical microscope (40X). First, look at the 10X objective, locate the counting area, bring it to the center of the field of view, switch to the 40X objective. Repeat the count 2 times.
Blood sample staining method
Use a 1ml syringe to collect blood from the blood vessel in the tail of the fish. Put 1 drop of blood on the slide and spread the sample evenly, let it dry naturally in the air. Fix the sample with methanol.
Stain the sample according to the method of Humason (1979) cited by Rowley (1993). Put the sample slide in Wright's solution for 3-5 minutes. Transfer the sample to pH 6.2-6.8 solution for 5-6 minutes. Then put it in Giemsa solution for 20-30 minutes. Continue to put the sample in pH 6.2 solution for 15-30 minutes. Rinse again with distilled water, let dry naturally and read the results under the microscope.
Quantification and typing of white blood cells (Hrubec et al , 2000)
Observe the sample slide under the microscope at a 100x objective with an oil drop. After staining the leukocytes, we count them. On each slide, count 1500 cells in a zigzag pattern.
Total white blood cell count (TBC) is determined by counting the total number of 1500 red blood cells and white blood cells on a smear.
(White blood cell count x red blood cell density)
TBC (tb/mm 3 ) =
Number of red blood cells on sample slide
Count 200 white blood cells to determine the density of each type of white blood cell.
Number of each type of white blood cell x TBC
Density of each type of white blood cell (cells/mm 3 ) =
200
3.3.3.2 Method for determining lysozyme content in serum
Lysozyme content in serum was determined according to the method of Ellis (1990) cited by Doan Nhat Phuong (2007) as follows:
- Micrococcus lysodeikticus solution was prepared by adding 75 mg of Micrococcus lysodeikticus bacteria (R3770, sigma) to 100 ml of phosphate buffer saline (PBS).
- Standard lysozyme concentrations were prepared by adding 20 mg of lysozyme to 10 ml of phosphate buffer saline (PBS) to obtain a lysozyme solution with a concentration of 20 µg/ml. Then, 0.5 ml of the 20 µ g/ml lysozyme solution was added to 0.5 ml of PBS to obtain a lysozyme solution with a concentration of 10 µg/ml. Next, 0.5 ml of the 10 µg/ml lysozyme solution was added to 0.5 ml of PBS to obtain a lysozyme solution with a concentration of 5 µg/ml. Next, 0.5 ml of the 5 µg/ml lysozyme solution was added to 0.5 ml of PBS to obtain a lysozyme solution with a concentration of 2.5 µg/ml. Continue to take 100µl of lysozyme solution with concentration of 10µg/ml into 0.9ml of PBS to get lysozyme solution with concentration of 1µg/ml. Continue to take 0.5ml of lysozyme solution with concentration of 1µg/ml into 0.5ml of PBS
lysozyme solution with concentration of 0.5µg/ml. From there, a standard curve was constructed for different concentrations of lysozyme.
The analysis was carried out on a 96-well plate with three replicates. Add 20 µl of standard lysozyme solution at each concentration, 20 µl of fish serum solution and 20 µl of PBS solution (blank sample) to 3 different wells and repeat 3 times. Then continue to add 250 µl of PBS solution (blank sample) to the first 3 wells and 250 µl of Micrococcus lysodeikticus solution to the remaining 3 wells. After adding the sample to the 96-well plate, shake well, read quickly at 530 nm wavelength with a microplate reader. After measuring, wait 5 minutes, shake well again and measure again. The activity of lysozyme in the serum sample was determined from the above standard curve.
3.3.3.3 Determination of bactericidal ability of serum
The bactericidal ability of the serum was determined according to the method of Secombes (1990).
Method: After the bacterial plate has been purified, select 1 colony to grow in NB medium for 48 hours at 28 0 C. Dilute the bacteria to a density of 10 4 cfu/ml. Then dilute the serum 10 times in saline. Add 100 µl of NB solution to all wells, then add 100 µl of serum solution to the wells except the control and blank wells, then add NB (TSB), continue to add 30 µl of bacteria to the wells except the blank well, then add NB (TSB) and incubate overnight at 28 0 C. Then add 10 µl of MTT (5 mg/ml of distilled water) to the wells, shake for 15 seconds and measure at 600 nm wavelength.
Reading the results: The percentage of viable bacteria is calculated using the following formula PSA = ((OD Sample - OD blank )/(OD control - OD blank ))x100
OD is the reading at 600 nm wavelength.
3.4 Experimental system management
- The experiment was arranged in 250 liter plastic buckets, each plastic bucket had 30 fish. Check the system daily, record signs of disease, and number of dead fish.
- The food used for fish is industrial food containing 28% protein, specialized for Pangasius fish fry of Proconco Can Tho company.
- Fish were fed on demand (about 3 times/day) with pelleted food with a diet containing Astragalus (0.5%) for 5 weeks. For control fish
negative (NT1) and positive controls (NT5) were fed a basal diet without herbal supplementation.
- How to mix: Dissolve Astragalus in water and spray evenly on the food, wait until the food pellets are slightly dry, then coat the outside with squid liver oil and feed to the fish.
- Blood samples (3 animals/treatment) were taken from the caudal aorta (Houston, 1990) after 1, 2, 3, 4 and 5 weeks after feeding. Heparin anticoagulant was used.
- Each fish was bled once to avoid affecting the test results due to excessive bleeding and stress.
3.5 Data processing method
The results are presented as the mean of 5 fish (± standard error), and were compared at each time point using one-way ANOVA and Duncan's multiple-choice test (SPSS 13). There was a statistical difference between the experiments at the 95% significance level. The mortality rate (obtained at the end of the experiment) in each treatment group was compared with the control group using the Chi-square test (SPSS 13). The difference between the control and treatment groups was significant at P < 0.001 and P < 0.05.
CHAPTER 4
RESULTS AND DISCUSSION
4.1 Effects of Astragalus extract on hematological parameters of pangasius fish.
4.1.1 Red blood cells


The results (Figure 4.1) showed that after 5 weeks of experiment, the average number of red blood cells between treatments ranged from 1.40 x 10 6 cells/ml to 2.02 x 10 6 cells/ml and the difference was statistically significant (P < 0.05) between the experimental treatments.


Figure 4.1 Comparison chart of red blood cell count of experimental treatments after 5 weeks. NT1: Feeding food without Astragalus supplement. NT2: Feeding food with Astragalus supplement. NT3: Feeding food without Astragalus supplement and vaccination in the 3rd week. NT4: Feeding food with Astragalus supplement and vaccination in the 3rd week. (*) Shows statistically significant difference (p<0.05)
The analysis results showed that after the first two weeks of the experiment, the number of red blood cells of fish in NT2 and NT4 was statistically higher (p<0.05) than in NT1 and NT3. This result is similar to the study of Tran Thi Yen Nhi and Dang Thi Hoang Oanh (2010) when comparing the number of red blood cells between pangasius fed with food supplemented with royal jelly.
The results showed that the number of red blood cells in fish supplemented with astragalus was higher than that in fish not supplemented with astragalus and the difference was statistically significant (p<0.05).
After vaccination for NT3 and NT4 in the 3rd week, the number of red blood cells of fish in these treatments increased significantly compared to weeks 1 and 2. After 5 weeks of feeding, the number of red blood cells in NT4 was the highest, followed by NT2, NT3 and the lowest was NT1. The difference between NT2 and NT1 was statistically significant, however, the difference between NT2 and NT3 was not statistically significant (p>0.05). The difference between NT4 and NT2 and NT3 was statistically significant (p<0.05). This shows that adding Astragalus to the diet increased the number of red blood cells, helping to transport and distribute oxygen to tissues better. In summary, the number of red blood cells increased steadily over the weeks and the difference was statistically significant between the treatments with and without Astragalus.
According to Jeney et al. (2002), adding vitamin U at a concentration of 100 ppm to the feed of hybrid sturgeon for 4 weeks increased phagocytic activity and increased leukocyte circulation compared to the group of fish not supplemented with vitamin U. However, when adding vitamin C to the feed of hybrid sturgeon, the number of red blood cells and leukocytes was lower than the control group and the difference was statistically significant.
According to the study of Yin et al . (2008), when raising carp, combining vaccination and feeding Astragalus and Ganoderma mushrooms ( Astragalus and Ganoderma) stimulates respiratory activity and phagocytosis of blood leukocytes. In addition, in Tilapia ( Oreochromis niloticus ), when fed two herbs, Astragalus membranaceus and Lonicera japonica , at a concentration of 0.1% for 4 weeks. The results showed that the fish's immune system was enhanced. Macrophage activity, blood cell respiration were enhanced and survival rate increased (Ardó et al ., 2008).
This shows that although fish species are different, adding Astragalus to the diet increases the activity of blood cells, leading to an increase in the number of red blood cells and a significant difference between treatments (p<0.05).
4.1.2 White blood cells
The results of leukocyte quantification and classification show that there are 4 types of leukocytes: lymphocytes, monocytes, neutrophils and platelets (Figure 4.2). The number of total leukocytes, lymphocytes, monocytes, neutrophils and platelets