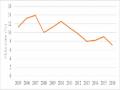
Table 3.24 . Absolute growth rate of experimental chickens over weeks of age
(Unit: g/head/day)
Weeks old
KPDC | KPTN | SEM | P | |
1 | 9.91 ± 0.33 | 10.35 ± 0.34 | 0.53 | 0.449 |
2 | 14.66 ± 0.35 | 15.93 ± 0.34 | 0.22 | 0.004 |
3 | 19.17 ± 0.51 | 20.07 ± 0.88 | 0.77 | 0.310 |
4 | 17.84 ± 1.41 | 17.68 ± 1.16 | 1.75 | 0.931 |
5 | 24.23 ± 0.93 | 27.58 ± 0.77 | 1.53 | 0.093 |
6 | 17.45 ± 0.56 | 18.01 ± 0.43 | 0.63 | 0.426 |
7 | 14.54 ± 0.80 | 16.85 ± 1.07 | 0.92 | 0.067 |
8 | 11.01 ± 0.91 | 13.47 ± 1.07 | 1.66 | 0.213 |
9 | 10.42 ± 1.55 | 8.77 ± 0.93 | 2.28 | 0.511 |
10 | 8.33 ± 0.71 | 11.31 ± 1.04 | 0.82 | 0.022 |
11 | 7.56 ± 0.81 | 6.21 ± 1.44 | 1.53 | 0.427 |
12 | 2.34 ± 1.07 | 3.35 ± 1.00 | 1.69 | 0.580 |
TB | 13.33 ± 0.21 | 14.35 ± 0.12 | 0.11 | 0.001 |
Maybe you are interested!
-

 Basic Burn Rate Experimental Formulas
 -
 GDP and GDP Growth Rate of Hanoi as of December 31, 2006, by Economic Sector - Calculated at 1994 Prices
 -
 Comparison of the Income Growth Rate of Employees and Profit Growth of 3 Joint Stock Companies.
 -
 Economic Growth Rate of Thua Thien Hue Province in the Period 2005 - 2016
 -
 Total Tourism Revenue Growth Rate (2009 - 2018)
Table 3.25. Relative growth rate of experimental chickens over weeks of age
(Units: %)
Weeks old
KPDC | KPTN | SEM | P | |
1 | 70.53 ± 1.38 | 72.62 ± 1.50 | 2.26 | 0.408 |
2 | 70.19 ± 1.75 | 72.97 ± 1.59 | 1.48 | 0.135 |
3 | 50.70 ± 1.22 | 50.31 ± 1.57 | 0.93 | 0.701 |
4 | 31.64 ± 2.39 | 30.17 ± 2.11 | 3.13 | 0.663 |
5 | 31.32 ± 1.14 | 33.92 ± 1.01 | 1.85 | 0.232 |
6 | 17.79 ± 0.63 | 17.30 ± 0.42 | 0.72 | 0.534 |
7 | 12.73 ± 0.66 | 13.86 ± 0.87 | 0.59 | 0.130 |
8 | 8.66 ± 0.69 | 9.85 ± 0.76 | 1.27 | 0.403 |
9 | 7.56 ± 1.13 | 5.93 ± 0.61 | 1.61 | 0.367 |
10 | 5.67 ± 0.48 | 7.17 ± 0.66 | 0.52 | 0.045 |
11 | 4.88 ± 0.51 | 3.72 ± 0.87 | 0.99 | 0.309 |
12 | 1.45 ± 0.66 | 1.96 ± 0.58 | 1.02 | 0.641 |
Table 3.26. Food intake of experimental chickens over weeks of age
(Unit: g DM/head/day)
Weeks old
KPDC | KPTN | SEM | P | |
1 | 12.43 ± 0.03 | 12.51 ± 0.02 | 0.03 | 0.054 |
2 | 23.67 ± 0.00 | 23.84 ± 0.04 | 0.04 | 0.011 |
3 | 36.78 ± 0.02 | 37.22 ± 0.42 | 0.43 | 0.362 |
4 | 46.41 ± 0.88 | 48.13 ± 0.02 | 0.88 | 0.123 |
5 | 51.89 ±2.36 | 51.10 ± 5.27 | 5.33 | 0.890 |
6 | 51.64 ± 1.88 | 46.31 ± 4.20 | 4.32 | 0.285 |
7 | 50.48 ± 1.92 | 43.51 ± 3.87 | 4.02 | 0.158 |
8 | 53.49 ± 1.79 | 47.50 ± 3.74 | 4.49 | 0.253 |
9 | 51.10 ± 2.51 | 45.58 ± 3.50 | 4.49 | 0.286 |
10 | 51.01 ± 2.43 | 41.61 ± 2.47 | 3.27 | 0.045 |
11 | 51.06 ± 3.08 | 41.00 ± 2.61 | 3.25 | 0.037 |
12 | 40.80 ± 2.53 | 34.12 ± 2.94 | 3.17 | 0.103 |
TB | 43.40 ± 1.41 | 39.37 ± 2.21 | 2.49 | 0.181 |
Table 3.27. Feed efficiency of experimental chickens
Index
KPDC | KPTN | SEM | P | |
Total feed intake (g/head) | 3620±119 | 3282±186 | 209 | 0.181 |
Total weight gain (g/head) | 1082±17 | 1166±11 | 9.45 | 0.001 |
FCR | 3.35 ± 0.16 | 2.81 ± 0.16 | 0.19 | 0.046 |
Total protein consumed (g/head) | 761.28 ± 24.50 | 667.35 ± 37.10 | 42.07 | 0.089 |
Efficient use of protein | 1.43 ± 0.07 | 1.77 ± 0.12 | 0.12 | 0.045 |
The results of the survey and assessment of carcass quality indicators are presented in table 3.28. Due to the difference in live weight of chickens before slaughter between the two treatments, jaw weight and carcass weight of chickens between the two treatments were significantly different (P < 0.05). The rate of chicken hook meat in the experimental treatment tended to be 0.57% higher than in the control treatment. There was no statistically significant difference in jaw hook rate and carcass rate between the two treatments. The survey results also showed that the belly fat ratio of chickens in the experimental treatment tended to decrease by 2.18% compared to chickens in the control treatment.
proof. However, this difference is not statistically significant (P > 0.05). This result is similar to the research results of Rosa et al. (2007) [200]. When studying two broiler breeds PCLC and AgRoss 308, Rosa et al. (2007) reported that although dietary energy levels improved growth performance in chickens, there was no effect on carcass, breast and wing meat ratios [200].
Index | KPDC | KPTN | SEM | P |
Live weight (g) | 1120.63 ± 13.45 | 1203.75 ± 24.53 | 30.14 | 0.028 |
Mass of jaw hook (g) | 918.30 ± 9.57 | 991.85 ± 19.13 | 21.60 | 0.011 |
Jaw hook rate (%) | 81.96 ± 0.40 | 82.43 ± 0.62 | 0.91 | 0.626 |
Carcass weight (g) | 771.63 ± 11.77 | 825.37 ± 18.79 | 20.88 | 0.037 |
Carcass ratio (%) | 68.85 ± 0.52 | 68.56 ± 0.62 | 0.87 | 0.751 |
Weight of upper thigh meat (thigh) * (g) | 101.01 ± 3.39 | 108.92 ± 3.11 | 4.19 | 0.101 |
The ratio of meat to the upper part of thighs (%) | 13.12 ± 0.49 | 13.21 ± 0.36 | 0.61 | 0.875 |
Weight of lower thigh meat (drumstick) ** (g) | 123.23 ± 2.83 | 138.13 ± 4.54 | 6.84 | 0.066 |
The proportion of meat in the lower part of the thighs (%) | 15.99 ± 0.42 | 16.77 ± 0.56 | 0.77 | 0.346 |
Total thigh meat weight ( * + ** ) (g) | 224.24 ± 3.08 | 247.05 ± 4.74 | 5.01 | 0.003 |
Percentage of whole thigh meat (%) | 29.11 ± 0.61 | 29.99 ± 0.57 | 0.63 | 0.208 |
Breast meat weight (g) | 117.37 ± 5.33 | 127.57 ± 5.12 | 8.15 | 0.251 |
Percentage of breast meat (%) | 15.24 ± 0.75 | 15.45 ± 0.49 | 0.89 | 0.819 |
Wing mass (g) | 102.65 ± 1.77 | 108.62 ± 3.69 | 5.24 | 0.292 |
Percentage of wing meat (%) | 13.32 ± 0.28 | 13.18 ± 0.41 | 0.58 | 0.817 |
Abdominal fat mass (g) | 42.83 ± 8.34 | 44.76 ± 5.25 | 10,18 | 0.855 |
Percentage of belly fat (%) | 5.50 ± 1.04 | 5.38 ± 0.57 | 1.27 | 0.924 |
Liver (g) | 21.32 ± 1.05 | 19.77 ± 1.33 | 1.56 | 0.351 |
Heart (g) | 4.89 ± 0.76 | 4.71 ± 0.30 | 0.64 | 0.789 |
Table 3.28. Carcass quality of experimental chickens
* : the thigh meat is separated from the body by a straight slice through the hip joint and separated from the lower half of the thigh by a straight slice through the knee joint; ** : the thigh meat is separated from the upper thigh by a straight slice through the knee joint
Table 3.29. Dehydration rate and pH value of meat
Index
KPDC | KPTN | SEM | P | ||
Preservation dehydration rate (%) | thigh meat | 0.75 ± 0.03 | 0.50 ± 0.03 | 0.04 | 0.000 |
breast meat | 1.86 ± 0.13 | 1.61 ± 0.12 | 0.17 | 0.174 | |
Processing dehydration rate (%) | thigh meat | 7.19 ± 0.71 | 7.46 ± 0.88 | 1.26 | 0.835 |
breast meat | 20.13 ± 1.12 | 19.46 ± 1.42 | 1.30 | 0.621 | |
Total dehydration rate (%) | thigh meat | 7.94 ± 0.69 | 7.96 ± 0.89 | 1.24 | 0.985 |
breast meat | 21.99 ± 1.16 | 21.07 ± 1.38 | 1.22 | 0.473 | |
pH 30 minutes after slaughter | thigh meat | 5.38 ± 0.05 | 5.51 ± 0.03 | 0.06 | 0.068 |
breast meat | 5.25 ± 0.10 | 5.45 ± 0.04 | 0.09 | 0.049 | |
pH after 24 hours of slaughter | thigh meat | 4.59 ± 0.07 | 4.60 ± 0.07 | 0.09 | 0.939 |
breast meat | 4.44 ± 0.07 | 4.32 ± 0.05 | 0.08 | 0.162 |
Samples of chicken thigh and breast meat in the two treatments were also used to analyze dehydration rate, pH and total nutrient composition. Although the rate of storage dehydration in chicken thigh meat in the control treatment was significantly higher than that in the experimental treatment (0.75% vs. 0.50%), the total dehydration rate in the meat was significantly higher. thighs were similar in both treatments (P > 0.05). There was no statistically significant difference in the rate of storage water loss, processing water loss rate and total water loss rate in chicken breast meat between the two treatments (table 3.29).
24 hours after slaughter, the pH in the thigh and chest muscles decreased significantly due to glycogen hydrolysis in the muscles after slaughter. At the same time, the pH value determined in thigh meat was higher than that in breast meat. This is because the glycogen content in red muscle is lower than in white muscle, so the anaerobic breakdown of glycogen to produce lactic acid in red muscle is lower than in white muscle [4]. There was no statistically significant difference in the pH value of chicken thigh meat between the two treatments at 30 minutes and 24 hours after slaughter (P > 0.05). The pH value of chicken breast meat in the control treatment was significantly lower than that in the experimental treatment (5.25 versus 5.45). However, at 24 hours after slaughter, the pH of chicken breast meat in the two treatments was similar (P > 0.05).
Table 3.30. Nutritional composition of experimental chicken meat (according to fresh state)
Index
KPDC | KPTN | SEM | P | ||
DM (%) | thigh meat | 27.65 ± 0.63 | 27.17 ± 1.05 | 0.81 | 0.618 |
breast meat | 27.26 ± 1.03 | 25.91 ± 0.32 | 0.74 | 0.208 | |
CP (%) | thigh meat | 19.93 ± 0.35 | 19.19 ± 1.13 | 1.15 | 0.586 |
breast meat | 23.75 ± 0.54 | 23.37 ± 0.21 | 0.73 | 0.658 | |
EE (%) | thigh meat | 6.34 ± 0.52 | 6.59 ± 1.04 | 1.13 | 0.847 |
breast meat | 1.26 ± 0.10 | 1.92 ± 0.05 | 0.15 | 0.047 | |
Ash (%) | thigh meat | 1.04 ± 0.02 | 1.05 ± 0.03 | 0.05 | 0.861 |
breast meat | 1.43 ± 0.19 | 1.35 ± 0.07 | 0.22 | 0.755 |
The results in table 3.30 show that the lipid content in breast meat of chickens in the experimental treatment was significantly higher than in the control treatment (1.92% vs. 1.26%, P < 0.05). Meanwhile, the lipid content in chicken thigh meat in the two treatments did not differ (P > 0.05). There were no significant differences in dry matter, protein and total mineral content in thigh and breast meat between the two treatments.
3.6. Experiment 6. Build a regression equation to estimate the metabolizable energy value of experimental foods and check the accuracy of the equation
3.6.1. Regression equations estimate metabolizable energy values in chicken feed
Data on the composition of total nutrients and ME N values in 7 different food groups (corn, rice bran with full oil, cassava flour, soybean with full oil, fish meal, protein-rich foods of plant origin animals and animal by-products) were used to build a regression equation to estimate the ME N value in each
group. A total of 104 regression equations with high adjusted R 2 coefficients were obtained
construction (table 3.31). The variables in the regression equations are diversified to facilitate the application of the regression equations even when only some analysis of the total nutrient content of the feed is performed.
Table 3.31. Regression equations estimate ME N values based on total nutrient composition
Type of consciousness
eat
Regression equation | R 2 correction | P | |
1. MEkcal = 2645 + 41.9 CP + 81.7 EE - 270 CF + 483 Ash | 87.9% | 0.000 | |
2. MEkcal = 50943 - 441 CP - 401 EE - 753 CF - 483 NfE | 87.9% | 0.000 | |
3. MEkcal = 6832 + 39.8 EE - 312 CF + 441 Ash - 41.9 NfE | 87.9% | 0.000 | |
4. MEkcal = 15960 - 81.9 CP - 332 CF - 133 NfE | 79.9% | 0.000 | |
Corn | 5. MEkcal = 3023 + 65.5 EE - 274 CF + 557 Ash 6. MEMJ = 11.1 + 0.175 CP + 0.342 EE - 1.13 CF + 2.02 Ash | 79.5% 87.9% | 0.000 0.000 |
7. MEMJ = 213 - 1.85 CP - 1.68 EE - 3.15 CF - 2.02 NfE | 87.9% | 0.000 | |
8. MEMJ = 28.6 + 0.167 EE - 1.30 CF + 1.85 Ash - 0.175 NfE | 87.9% | 0.000 | |
9. MEMJ = 66.8 - 0.342 CP - 1.39 CF - 0.556 NfE | 79.9% | 0.000 | |
10. MEMJ = 12.6 + 0.274 EE - 1.15 CF + 2.33 Ash | 79.5% | 0.000 | |
11. MEkcal = - 1836 + 483 CP - 148 EE - 69.4 Ash + 91.6 CF | 83.4% | 0.002 | |
12. MEkcal = 7321 + 391 CP - 240 EE - 161 Ash - 91.6 NfE | 83.4% | 0.002 | |
13. MEkcal = 46428 - 631 EE - 552 Ash - 391 CF - 483 NfE | 83.4% | 0.002 | |
14. MEkcal = - 8773 + 552 CP - 78.7 EE + 161 CF + 69.4 NfE | 83.4% | 0.002 | |
Bran | 15. MEkcal = - 8025 + 387 CP + 176 CF + 70.2 NfE | 72.3% | 0.004 |
rice | 16. MEkcal = - 1411 + 533 CP - 170 EE - 77.8 Ash | 70.8% | 0.005 |
original | 17. MEMJ = - 7.68 + 2.02 CP - 0.620 EE - 0.290 Ash + 0.383 CF | 83.4% | 0.002 |
oil | 18. MEMJ = 30.6 + 1.64 CP - 1.00 EE - 0.673 Ash - 0.383 NfE | 83.4% | 0.002 |
19. MEMJ = 194 - 2.64 EE - 2.31 Ash - 1.64 CF - 2.02 NfE | 83.4% | 0.002 | |
20. MEMJ = - 36.7 + 2.31 CP - 0.329 EE + 0.673 CF + 0.290 NfE | 83.4% | 0.002 | |
21. MEMJ = - 33.6 + 1.62 CP + 0.737 CF + 0.294 NfE | 72.3% | 0.004 | |
22. MEMJ = - 5.90 + 2.23 CP - 0.713 EE - 0.326 Ash | 70.8% | 0.005 | |
23. ME N KCal = 1325 - 780 CP - 1723 EE + 1421 Ash + 953 CF | 72.5% | 0.094 | |
24. ME N KCal = 143418 - 2201 CP - 3144 EE - 468 CF - 1421 NfE | 72.5% | 0.094 | |
25. ME N KCal = 1609 - 549 CP - 658 EE + 1336 CF | 72.3% | 0.044 | |
26. ME N KCal = 107606 - 1790 CP - 2518 EE - 1062 NfE | 78.9% | 0.026 | |
Tapioca starch | 27. MEkcal = - 76704 - 942 EE + 2201 Ash + 1733 CF + 780 NfE 28. MEkcal = - 66862 + 985 Ash + 1967 CF + 684 NfE 29. ME N MJ = 5.54 - 3.26 CP - 7.21 EE + 5.95 Ash + 3.99 CF | 72.5% 73.1% 72.5% | 0.094 0.042 0.094 |
30. ME N MJ = 600 - 9.21 CP - 13.2 EE - 1.96 CF - 5.95 NfE | 72.5% | 0.094 | |
31. ME N MJ = 6.73 - 2.30 CP - 2.76 EE + 5.59 CF | 72.3% | 0.044 | |
32. ME N MJ = 450 - 7.49 CP - 10.5 EE - 4.44 NfE | 78.9% | 0.026 | |
33. MEMJ = - 321 - 3.94 EE + 9.21 Ash + 7.25 CF + 3.26 NfE | 72.5% | 0.094 |
Type of consciousness
eat
Regression equation | R 2 correction | P | |
34. MEMJ = - 280 + 4.12 Ash + 8.23 CF + 2.86 NfE | 73.1% | 0.042 | |
35. MEkcal = 65408 + 714 CP - 75 EE - 13273 Ash - 2211 CF | 99.8% | 0.028 | |
36. MEkcal = - 155692 + 2925 CP + 2136 EE - 11062 Ash + 2211 NfE | 99.8% | 0.028 | |
37. MEkcal = 4540 + 357 EE - 1084 CF - 49.0 NDF | 96.9% | 0.018 | |
38. MEkcal = - 136894 + 1491 CP + 1944 EE - 39.1 NDF + 1524 NfE | 95.2% | 0.146 | |
39. MEkcal = - 1684 + 552 EE - 1235 CF - 46.0 NDF + 106 NfE | 94.3% | 0.160 | |
40. MEkcal = - 2249 + 198 CP - 71.0 NDF | 94.0% | 0.036 | |
Bean | 41. MEkcal = - 262041 + 2743 CP + 3738 EE + 2876 NfE | 93.7% | 0.038 |
soy sauce | 42. MEkcal = - 17333 + 1402 EE - 2637 CF + 320 NfE | 90.3% | 0.057 |
original | 43. MEMJ = 274 + 2.99 CP - 0.313 EE - 55.5 Ash - 9.25 CF | 99.8% | 0.028 |
oil | 44. MEMJ = - 651 + 12.2 CP + 8.94 EE - 46.3 Ash + 9.25 NfE | 99.8% | 0.028 |
45. MEMJ = 19.0 + 1.49 EE - 4.54 CF - 0.205 NDF | 96.9% | 0.018 | |
46. MEMJ = - 573 + 6.24 CP + 8.13 EE - 0.164 NDF + 6.38 NfE | 95.2% | 0.146 | |
47. MEMJ = - 7.0 + 2.31 EE - 5.17 CF - 0.192 NDF + 0.44 NfE | 94.3% | 0.160 | |
48. MEMJ = - 9.4 + 0.83 CP - 0.001 EE - 0.297 NDF | 94.0% | 0.036 | |
49. MEMJ = - 1096 + 11.5 CP + 15.6 EE + 12.0 NfE | 93.7% | 0.038 | |
50. MEMJ = - 73 + 5.86 EE - 11.0 CF + 1.34 NfE | 90.3% | 0.057 | |
51. ME N Kcal = 17117 - 143 CP - 171 EE - 183 Ash + 151 CF | 68.7% | 0.039 | |
52. MEkcal = 32178 - 294 CP - 322 EE - 334 Ash - 151 NfE | 68.7% | 0.039 | |
53. ME N Kcal = - 1200 + 39.9 CP + 11.9 EE + 334 CF + 183 NfE | 68.7% | 0.039 | |
54. ME N Kcal = 20612 - 178 CP - 193 EE - 220 Ash | 69.3% | 0.017 | |
Fish meal | 55. MEkcal = 2786 - 28.0 EE - 39.9 Ash + 294 CF + 143 NfE 56. ME N MJ = 71.6 - 0.600 CP - 0.717 EE - 0.766 Ash + 0.630 CF | 68.7% 68.7% | 0.039 0.039 |
57. MEMJ = 135 - 1.23 CP - 1.35 EE - 1.40 Ash - 0.630 NfE | 68.7% | 0.039 | |
58. ME N MJ = - 5.02 + 0.167 CP + 0.050 EE + 1.40 CF + 0.766 NfE | 68.7% | 0.039 | |
59. ME N MJ = 86.2 - 0.745 CP - 0.806 EE - 0.920 Ash | 69.3% | 0.017 | |
60. MEMJ = 11.7 - 0.117 EE - 0.167 Ash + 1.23 CF + 0.600 NfE | 68.7% | 0.039 | |
Awake eat rich | 61. MEkcal = 5138 - 15.7 CP + 25.7 EE - 246 Ash - 59.4 CF - 2.61 NDF 62.MEkcal = 4838 - 11.2 CP + 29.9 EE - 238 Ash - 63.6 CF | 98.7% 98.8% | 0.000 0.000 |
protein | 63. MEkcal = - 804 + 43.7 CP + 85.1 EE - 187 Ash - 2.61 NDF + 59.4 NfE | 98.7% | 0.000 |
Have | 64.MEkcal = - 1519 + 52.4 CP + 93.5 EE - 174 Ash + 63.6 NfE | 98.8% | 0.000 |
source | 65. MEkcal = - 19512 + 231 CP + 272 EE + 187 CF - 2.61 NDF + 246 NfE | 98.7% | 0.000 |
origin | 66. MEkcal = - 18926 + 226 CP + 268 EE + 174 CF + 238 NfE | 98.8% | 0.000 |
real | 67. MEkcal = 3566 + 41.4 EE - 231 Ash - 43.7 CF - 2.61 NDF + 15.7 NfE | 98.7% | 0.000 |
object | 68. MEkcal = 4102 + 40.5 EE - 216 Ash - 73.2 CF + 6.15 NDF | 98.6% | 0.000 |
Type of consciousness
eat
Regression equation | R 2 correction | P | |
69. MEkcal = 3722 + 41.1 EE - 226 Ash - 52.4 CF + 11.2 NfE | 98.8% | 0.000 | |
70. MEMJ = 21.5 - 0.0658 CP + 0.108 EE - 1.03 Ash - 0.249 CF - 0.0109 NDF | 98.7% | 0.000 | |
71.MEMJ = 20.2 - 0.0467 CP + 0.125 EE - 0.994 Ash - 0.266 CF | 98.8% | 0.000 | |
72. MEMJ = - 3.36 + 0.183 CP + 0.356 EE - 0.783 Ash - 0.0109 NDF + | 98.7% | 0.000 | |
0.249 NfE | |||
73.MEMJ = - 6.35 + 0.219 CP + 0.391 EE - 0.728 Ash + 0.266 NfE | 98.8% | 0.000 | |
74. MEMJ = - 81.6 + 0.966 CP + 1.14 EE + 0.783 CF - 0.0109 NDF + | 98.7% | 0.000 | |
1.03 NfE | |||
75. MEMJ = - 79.2 + 0.948 CP + 1.12 EE + 0.728 CF + 0.994 NfE | 98.8% | 0.000 | |
76. MEMJ = 14.9 + 0.173 EE - 0.966 Ash - 0.183 CF - 0.0109 NDF + | 98.7% | 0.000 | |
0.0658 NfE | |||
77. MEMJ = 17.2 + 0.170 EE - 0.902 Ash - 0.306 CF + 0.0258 NDF | 98.6% | 0.000 | |
78.MEMJ = 15.6 + 0.172 EE - 0.948 Ash - 0.219 CF + 0.0467 NfE | 98.8% | 0.000 | |
79. MEkcal = - 43 + 23.9 CP + 108 EE + 5.6 Ash - 33.1 CF + 5.6 NDF | 100% | 0.000 | |
80. MEkcal = 181 + 26.8 CP + 81.3 EE + 1.02 Ash - 28.5 CF | 100% | 0.000 | |
81.MEkcal = - 3357 + 57.0 CP + 141 EE + 38.8 Ash + 5.6 NDF + 33.1 NfE | 100% | 0.000 | |
82.MEkcal = - 911 + 43.2 CP + 68.2 EE + 9.1 Ash - 6.2 NDF | 100% | 0.000 | |
83.MEkcal = - 2668 + 55.3 CP + 110 EE + 29.5 Ash + 28.5 NfE | 100% | 0.000 | |
84.MEkcal = 518 + 18.2 CP + 103 EE - 38.8 CF + 5.6 NDF - 5.6 NfE | 100% | 0.000 | |
85.MEkcal = 284 + 25.7 CP + 80.3 EE - 29.5 CF - 1.02 NfE | 100% | 0.000 | |
86.MEkcal = 362 + 23.4 CP + 86.6 EE - 34.3 CF + 1.73 NDF | 100% | 0.000 | |
87.MEkcal = - 292 + 43.6 CP + 30.0 EE - 13.2 NDF | 100% | 0.000 | |
Extra | 88.MEkcal = 200 + 26.0 CP + 90.7 EE - 38.7 NfE | 99.9% | 0.000 |
product | 89.MEkcal = 6264 - 132 EE - 76.9 Ash - 37.7 NDF - 103 NfE | 99.8% | 0.000 |
animal | 90.MEkcal = 2752 + 73.9 EE - 26.2 Ash - 98.6 NfE 91.MEkcal = 4010 - 44.4 Ash - 13.5 NDF - 100 NfE 92.MEMJ = - 0.18 + 0.0998 CP + 0.453 EE + 0.0235 Ash - 0.139 CF | 99.8% 99.8% 100% | 0.000 0.000 0.000 |
+ 0.0233 NDF | |||
93.MEMJ = 0.76 + 0.112 CP + 0.340 EE + 0.0043 Ash - 0.119 CF | 100% | 0.000 | |
94.MEMJ = - 14.0 + 0.238 CP + 0.592 EE + 0.162 Ash + 0.0233 NDF | 100% | 0.000 | |
+ 0.139 NfE | |||
95.MEMJ = - 3.81 + 0.181 CP + 0.285 EE + 0.0380 Ash - 0.0259 NDF | 100% | 0.000 | |
96.MEMJ = - 11.2 + 0.231 CP + 0.459 EE + 0.124 Ash + 0.119 NfE | 100% | 0.000 | |
97.MEMJ = 2.17 + 0.0763 CP + 0.430 EE - 0.162 CF + 0.0233 NDF - | 100% | 0.000 | |
0.0235 NfE | |||
98.MEMJ = 1.19 + 0.108 CP + 0.336 EE - 0.124 CF - 0.0043 NfE | 100% | 0.000 |