Table 2.4: Nutrition for experimental calves after supplementing with concentrated TA compared to the control group and feeding needs
Food type
VCK (kg/head) | Raw Pr (g/head) | NLT (kcal/piece) | Calcium (g/head) | Phosphorus (g/kg) | |
Feed requirements of beef cattle 100 kg weight gain 500gr/head/day | 3.0 | 379 | 5,280 | 15 | 9 |
Control batch (TA and nutrition/child/day) | 2.3 | 187 | 5.055 | 10 | 5 |
Experimental batch (after addition) Supplement 0.8 kg TABS / head / day / head / day) | 3.0 | 378 | 7,180 | 16 | 13 |
Maybe you are interested!
-
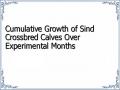
 Cumulative Growth of Sind Crossbred Calves Over Experimental Months
 -
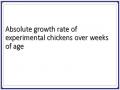 Absolute growth rate of experimental chickens over weeks of age
 -
 Basic Burn Rate Experimental Formulas
 -
 Compare Test Scores Between the Experimental Class and the Control Class
 -
 Evaluation of Experimental Results and Verification Experiments
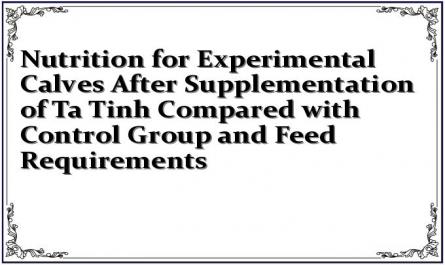
(Note: TABS: Food supplement)
Thus, the supplementary diet in Table 2.4 can meet the basic nutritional needs of Sind Lai calves.
2.4. RESEARCH INDICATORS AND DETERMINATION METHODS
2.4.1. Research indicators
2.4.1.1. Indicators for investigation and survey of local yellow cattle.
- Distribution and fluctuations of local cattle herds over 3 years.
- Local yellow cattle herd structure.
- The scale of local cattle herds raised in households.
- Growth capacity of cattle from birth to 36 months of age.
+ Cumulative growth (kg/head).
+ Absolute growth (g/head/day)
+ Relative growth (%/month)
- Dimensions of yellow cows: Chest circumference, diagonal body length, fin height, tube circumference by month of age (cm).
2.4.1.2. Monitoring indicators of 2 experiments
* Experiment 1: Study the effect of using 7/8 Sind blood bulls on the survival and growth rate of crossbred calves from 6 to 12 TT, including the following indicators:
- Survival rate of crossbred calves from birth to 12 months of age.
- Cumulative growth of crossbred calves from birth to 12 months of age (kg/head)
- Absolute growth of calves (gr/calf/day)
- Relative growth of calves (%/month).
- Dimensions of some main dimensions of the calf (cm): Chest circumference, diagonal body length, fin height, tube circumference.
* Experiment 2: Study the effect of supplementing concentrated feed on the survival and growth rate of crossbred calves from 6 to 10 TT, including the following indicators:
- Survival rate of crossbred calves from 6 to 10 months old.
- Cumulative growth of crossbred calves from 6 to 10 months old (kg/head).
- Absolute growth of calves (gr/calf/day).
- Relative growth of calves (%/month).
- Dimensions of some main dimensions of crossbred calves (cm): Chest circumference, diagonal body length, fin height, tube circumference.
- Preliminary calculation of supplementary feed costs for experimental calves.
2.4.2. Method of determining monitoring and survey indicators
2.4.2.1. Determination of weight: The weight of newborn calves is determined by weighing them after birth, before they start to drink colostrum. The weight of calves at different months of age is determined by direct weighing and measuring the dimensions with a tape measure. The formula for determining the weight through measurements is as follows:
+ For local yellow cows: Determined according to Nguyen Van Thien's formula:
P(kg) = (VN) 2 (m) x DTC (m) x 90
+ For the weight of Sind crossbred cattle: Determined according to the formula of Le Viet Ly and CS, 1995, pages 82-87 [13].
P(kg) = (VN) 2 (m) x DTC(m) x 94.3
2.4.2.2. Absolute growth is determined by the formula
W 1 – W 0
A x =
t 1 – t 0
In which: Ax: Absolute growth rate (gr/individual/day) t 0 : Time to start monitoring
t 1 : Time to end tracking
W 0 : Initial mass at the time of monitoring W 1 : Mass at the end of monitoring
2.4.2.3. Relative growth is determined by the formula
W 1 – W 0 x 100
R(%) = W 1 + W 0
2
2.4.2.4. Dimensions of some main measurements: Chest circumference, diagonal body length, fin height, tube circumference. These indexes are determined as follows:
+ Diagonal body length (DTC): Measure from the anterior end of the scapula-humeral joint to the posterior tip of the ischial tuberosity (cm) using a tape measure.
+ Chest circumference (VN): Measure the chest circumference behind the shoulder blades (cm) using a tape measure.
+ Shoulder height (CV): Measure from the ground to the highest point of the shoulder (cm), using a measuring stick.
+ Tube circumference (VO): Measure the circumference of the upper 1/3 of the forefoot bone, on the left side at the smallest point (cm), using a tape measure.
2.4.2.5. Survival rate: Determined by the formula:
Number of children alive
Survival rate (%) =
Total number of children born
x 100
2.4.2.6. Accounting for feed costs: Monitor feed costs and calf selling prices at the time of the experiment to preliminarily calculate whether this feed supplement is economically effective or not.
2.5. DATA PROCESSING METHOD
The collected data will be processed using biological statistics according to the textbook "Research methods in animal husbandry" by Nguyen Van Thien, Nguyen Khanh Quac, Nguyen Duy Hoan, 2002 [23]. Statistical parameters are processed on a computer using Excel 7.0 program, including:
- Average number ( X ): (*) When n < 30:
X X 1 X 2 X 3 ... X n
n
X
n
In which: X is the average number
X 1 , X 2 , X 3 ..., Xn are the values of the variables
X: Is the sum of the values of xn is the sample size
- Standard deviation ( Sx ):
X 2 ( X 2) / nn 1
x
S
In there:
Sx : Is the standard deviation X: Is the value of the variables n: Is the sample size
- Coefficient of variation (Cv%):
Cv (%) S x 100
X
- Error of the average number ( m x ) :
n 1
S x
m x
Chapter III
RESULTS AND DISCUSSION
3.1. RESULTS OF INVESTIGATION AND ASSESSMENT OF THE CURRENT STATUS OF LOCAL CATTLE HERD
3.1.1. Development situation of yellow cattle breeding in the investigated communes
3.1.1.1. Number, distribution and fluctuations of Cho Don yellow cattle herd in the last 3 years
To assess the development of cattle breeding, we conducted a survey on the number, distribution and fluctuations of cattle herds in 4 communes representing 3 different regions of Cho Don district in the last 3 years. The results are presented in Table 3.1.
Table 3.1: Number, distribution and fluctuations of cattle herds in 4 surveyed communes over the past 3 years
STT
Commune name | 2004 | 2005 | 2006 | |||
Quantity (Child) | Quantity (Child) | Compared to 2004 (%) | Quantity (Child) | Compared to 2005 (%) | ||
1 | Ngoc Sect | 168 | 163 | 97.02 | 225 | 138.04 |
2 | Phuong Vien | 145 | 140 | 96.55 | 352 | 251.42 |
3 | Broken | 35 | 45 | 128.57 | 131 | 291.11 |
4 | Binh Trung | 71 | 81 | 114.08 | 159 | 196.30 |
Total | 419 | 429 | 102.39 | 867 | 202.10 | |
Through table 3.1 we see:
- The total herd of cattle in the 4 communes tends to increase gradually each year. It increased slowly from 2004 - 2005 and increased very rapidly in 2006. As of 2006, the total
The herd of 4 communes is 867 heads, an increase of 438 heads or 102.10% compared to 2005 (only 429 heads). The average herd growth rate after 3 years is 41.80%/year.
- In general, the distribution of cattle among the four communes is uneven. The commune with the largest number of cattle is Phuong Vien (352 cows), followed by Ngoc Phai (225 cows), Binh Trung (159 cows), and Ra Ban (131 cows).
The rate of herd growth from 2004 to 2006 in the communes was very fast, the highest was in Ra Ban commune from 35 heads (2004) to 131 heads (2006), an increase of 274.29%, Phuong Vien commune increased by 142.76%, Binh Trung commune increased by 123.94%, Ngoc Phai commune increased by 33.93%.
The reason for the increase in herd over the years is due to natural reproduction and the above 4 communes are project communes, so thanks to the propaganda and mobilization of officials, investment, financial and scientific and technical support from the State, many households have bought cows from other places to develop livestock farming locally.
3.1.1.2. Herd structure in investigated communes of Cho Don district
We conducted a survey on the cattle herd structure in the four communes surveyed above. The results are shown in Table 3.2:
Table 3.2: Cattle herd structure in surveyed communes
TT
Investigation commune | Number of cows surveyed (head) | Cow | Bull (child) | |||||||||
number | Mother calf | Reserve | Reproduction | The old raise meat | number | Mother calf | Reserve | Male | Castrated male | |||
1 | Ngoc Sect | 225 | 162 | 24 | 40 | 90 | 8 | 63 | 29 | 9 | 5 | 20 |
2 | Phuong Vien | 352 | 271 | 41 | 68 | 146 | 16 | 81 | 40 | 13 | 7 | 21 |
3 | Broken | 131 | 104 | 16 | 24 | 59 | 5 | 27 | 9 | 6 | 4 | 8 |
4 | Binh Trung | 159 | 114 | 18 | 31 | 61 | 4 | 45 | 19 | 8 | 5 | 13 |
Total | 867 | 651 | 99 | 163 | 356 | 33 | 216 | 97 | 36 | 21 | 62 | |
Compare (% / total herd) | 100 | 75.09 | 11.40 | 18.80 | 41.09 | 3.80 | 24.91 | 11.19 | 4.15 | 2.42 | 7.15 | |
Through table 3.2. We see:
In the calf-calving stage, the ratio of male and female calves born is equal, male calves are 11.19%, female calves are 11.4%, the number of male/female calves is nearly 1:1. This ratio is in accordance with the natural law.
The gender structure of the cattle herds in the four investigated communes has a very large difference in the male-female ratio: Female cows account for a larger proportion than male cows: 651 females compared to 216 males, the female ratio is 75.09% and the male ratio is 24.91%.
The reason is that the communes surveyed above are all project communes, so the people who have been trained by the project have identified effective farming methods. In the process of selecting cows to raise, they have kept many female cows, in addition