25 %
22.1
20
15.3
16.7
15
12.8
≤ 20 years old
10.2
11.1
10.3
10 8.2 8.2
21-30 years old
≥31 years old
5
0
Shared
MDDP
MDNH
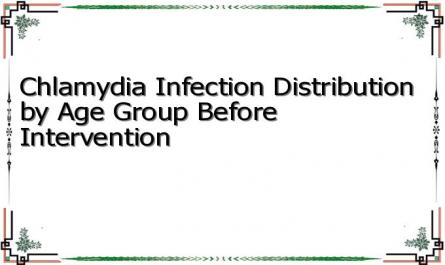
Figure 3.6. Distribution of Chlamydia infection by age group before intervention
Figure 3.6 shows that among people ≤ 20 years old, 12.8% were infected with Chlamydia. The infection rate in the age group 21-30 was 15.3% and the age group ≥ 31 years old was 10.2%. In the BDDP group, the infection rate in the age group ≤ 20 years old was 16.7%, in the age group 21-30 was 22.1% and in the age group ≥ 31 years old was 11.1%. In the BDNH group, the infection rate in the age group ≤ 20 years old was 10.3%, and in both the age groups 21-30 and ≥ 31 years old, the infection rate was 8.2%.
25 %
22.8
20
15
14.4
13.4
14 14.5
11.5
11.6
10 8.5
6.5
Maiden
Married Married
5
0
Shared
MDDP
MDNH
Figure 3.7. Distribution of Chlamydia infection by marital status before intervention (n=499)
Figure 3.7 shows that the Chlamydia infection rate in the never-married group (not married) is 14.4%, the married group is 11.5% and the ever-married group is 13.4%. In the BDNH group, the never-married and the married have an infection rate of less than 10% (6.5% and 8.5%) and the ever-married (including divorced/separated/widowed) have an infection rate of 11.6%. In the BDDP group, the never-married have a higher infection rate (22.8%) than the married (14%) and the ever-married (14.5%).
3.1.2.3. Rates of co-infection with HIV and STIs
Table 3.3. Distribution of STI infection rates by pre-CT HIV status
Infection rate
HIV (-) (n=416) | HIV (+) (n=83) | P | |||
SL | % | SL | % | ||
Gonorrhea | 9 | 2.2 | 0 | 0 | 0.17* |
Chlamydia | 58 | 13.9 | 9 | 10.8 | 0.45 |
Syphilis | 4 | 1.0 | 0 | 0 | 0.48* |
Maybe you are interested!
-
 HIV infection status and care and ARV treatment for children under 18 months of age born to infected mothers in Vietnam, 2010-2013 - 19
 -
 Distribution of Ascaris Infection Intensity by Gender (N=261)
 -
 HIV-STI infection status, some related factors and effectiveness of preventive intervention among Dao ethnic group in 3 communes of Yen Bai province, 2006-2012 - 18
 -
 Interview Questions on Knowledge, Attitudes, and Practices in Worm Infection Prevention.
 -
 Structure of Unemployment Benefits Recipients by Age Group and Gender from 2015 to 2019
* Fisher exact test According to table 3.3, among people infected with HIV, no one was infected with gonorrhea or syphilis. The rate of Chlamydia infection among people infected with HIV was 10.8% while among people not infected with HIV it was 13.9%.
3.1.3. HIV and STI risk behaviors of female sex workers in 4 districts of Hanoi in 2005-2006
3.1.3.1. Age of prostitution, duration of practice and number of sexual partners of female sex workers
Table 3.4. Age of prostitution, duration of practice and number of sexual partners
Feature
General (n=499) | BDDP (n=275) | BDNH (n=224) | p | |
Age of starting prostitution | ||||
Medium | 24.2 | 25.2 | 22.9 | 0.0001 |
Standard deviation | 5.9 | 6.7 | 4.5 | |
Time of practice | ||||
Medium | 4.1 | 4.4 | 3.7 | 0.047 |
Standard deviation | 3.9 | 4.1 | 3.5 | |
Number of sexual partners/month | ||||
Medium | 21.7 | 21.2 | 22.3 | 0.59 |
Standard deviation | 20.0 | 18.9 | 21.4 | |
Number of new visitors/month | ||||
Medium | 14.8 | 15.3 | 14.2 | 0.52 |
Standard deviation | 17.6 | 17.6 | 17.4 | |
Number of regular customers/month | ||||
Medium | 5.5 | 4.9 | 6.3 | 0.07 |
Standard deviation | 7.6 | 5.7 | 9.4 |
Table 3.4 shows that when PWID were about 24 years old, they started selling sex. The average age at which PWID started selling sex was higher than that of PWID (25.2 vs. 22.9; p=0.0001, t test). The average duration of selling sex was 4.1 years, the PWID group was 4.4 years, longer than the PWID (3.7 years) (p=0.047, t test). Each month, PWID surveyed before the intervention had 21.7 sexual partners, 14.8 strangers, and 5.5 regular customers. The number of regular customers and monthly strangers of PWID did not differ from that of PWID.
3.1.3.2. HIV knowledge of female sex workers in Hanoi before intervention
Table 3.5. Basic knowledge about HIV of female sex workers in Hanoi in 2005-2006
Knowledge about HIV
% | p | |||
Shared (n=499) | BDDP (n=275) | BDNH (n=224) | ||
Ever heard about HIV/AIDS | 87.2 | 85.5 | 89.3 | 0.20 |
Consider yourself at risk high HIV | 25.7 | 29.8 | 20.5 | 0.02 |
Full basic understanding of HIV | 43.1 | 36.4 | 51.3 | 0.001 |
Monogamous sex reduces the risk HIV infection risk | 81.6 | 77.8 | 86.2 | 0.02 |
Always use condoms correctly. reduce the risk of HIV infection | 83.8 | 81.1 | 87.1 | 0.07 |
Share BKT when TCMT works increased risk of HIV infection | 80.0 | 79.6 | 80.4 | 0.84 |
Use public toilets does not transmit HIV | 66.3 | 61.5 | 72.3 | 0.01 |
Mosquito or insect bites not HIV transmission | 56.3 | 50.9 | 62.9 | 0.007 |
Table 3.5 shows that in the pre-intervention survey, 87.2% of PWID had heard about HIV/AIDS. The proportion of PWID who thought they were at high risk of HIV infection was 25.7%. This proportion in the MSM group was 29.8%, significantly higher than that of the MSM group (20.5%) (p=0.02). The proportion of PWID who had basic knowledge about HIV before the survey was not high, accounting for 43.1% of the surveyed PWID. This proportion was higher in the MSM group than in the MSM group (51.3% compared to 36.4%, p=0.001). 81.6% of PWID understood that being faithful to one sexual partner was not
HIV infection and this partner does not have another partner reduces the risk of HIV infection, 83.8% understand the role of condoms in preventing sexually transmitted HIV infection and 80% of PWID know that sharing needles when injecting drugs increases the risk of HIV infection. The awareness of the protective role of condoms in preventing HIV as well as the risks of sharing needles between PWID and PWID groups did not differ significantly (p= 0.07 and p= 0.84). The rate of PWID denying misconceptions about HIV was lower (66.3% understood that using public toilets does not transmit HIV and 56.3% understood that mosquito or insect bites do not transmit HIV). In general, the rate of correct answers to questions about HIV by PWID was higher than that of PWID.
Table 3.6. Percentage of PNBD tested for HIV
Characteristic
Percentage | p | |||
General (n=435) | BDDP (n=235) | BDNH (n=200) | ||
Know where to do confidential HIV testing, voluntarily wish | 34.9 | 40.4 | 28.5 | 0.01 |
Ever tested for HIV | 43.0 | 39.6 | 47.0 | 0.12 |
Ever had voluntary HIV testing | 32.4 | 28.5 | 37.0 | 0.06 |
According to Table 3.6, the rate of PWUD knowing where to voluntarily and confidentially test for HIV was 34.9%, this rate was higher in the MSM than in the MSM (40.4% vs. 28.5%, p=0.01). The number of PWUD who had ever tested for HIV was 43%. The rate of ever testing for HIV in the MSM group was similar to that of the MSM group (39.6% vs. 47%, p=0.12). 32.4% of PWUD voluntarily tested for HIV.
3.1.3.3. Knowledge about STIs and attitudes towards handling signs of STI infection of PNBD before intervention
Table 3.7. Proportion of PNBDs who recognized STI symptoms before CT
STI Symptoms
Shared (n=499) | BDDP (n=275) | BDNH (n=224) | p | ||||
SL | % | SL | % | SL | % | ||
Symptoms of genital discharge | 318 | 63.7 | 174 | 63.3 | 144 | 64.3 | 0.81 |
Symptoms of painful urination | 141 | 28.3 | 83 | 30.2 | 58 | 25.9 | 0.29 |
Symptoms of genital warts | 72 | 14.4 | 53 | 19.3 | 19 | 8.5 | 0.001 |
Symptoms of lower abdominal pain | 101 | 20.2 | 54 | 19.6 | 47 | 21 | 0.71 |
Don't know what STI symptoms | 89 | 17.8 | 54 | 19.6 | 35 | 15.6 | 0.24 |
Know the 4 STI Symptoms | 11 | 2.2 | 10 | 3.6 | 1 | 0.4 | 0.02 |
According to Table 3.7, 63.7% of PWUD knew that genital discharge was a symptom of STI. Symptoms of painful urination, genital ulcers and lower abdominal pain were less recognized (accounting for 28.3%, 14.4% and 20.2% respectively). 17.8% of PWUD did not know any common STI symptoms, only 3.6% in the PWUD group and 0.4% in the PWUD group knew 4 symptoms.
6 % 0
50
49.6
46.5
44
40
30
20
20
TS ulcer
born
12.8
10
4
TS yes
born
0
Shared
MDDP
MDNH
Figure 3.8. History of STI infection of female sex workers in Hanoi before intervention
cards (n=499)
According to chart 3.8, up to 46.5% of PNBD had a history of genital discharge and 12.8% had a history of genital ulcers within 1 year before being interviewed. The rate of history of genital discharge in the BDDP group was not different from that in the BDNH group (p=0.22). BDNH had a lower history of genital ulcers than BDDP (4% vs. 20%, p=0.0001).
Table 3.8. Attitudes on handling STI symptoms in the most recent time
How to handle
n | % | |
Go to a state health facility for medical examination and treatment | 20 | 11.0 |
Go to private medical facility for examination and treatment | 50 | 27.5 |
Go to the pharmacy yourself to buy medicine | 120 | 65.9 |
Home remedies | 53 | 29.1 |
Do nothing | 22 | 12.1 |
Use condoms during symptoms | 24 | 13.2 |
Table 3.8 shows that, among those who answered about how they handled STI symptoms, only 11% went to public clinics and 27.5% went to private clinics. 65.9% bought medicine from pharmacies for treatment, 29.1% treated themselves at home and 12.1% did not handle anything. Only 13.2% used condoms during sexual intercourse while they had symptoms.
When infected with STIs, 79.4% of BDDPs bought medicine at the pharmacy to self-treat, higher than this rate in the BDNH group (57.9%). The difference was statistically significant with p=0.003 (Chi-square test)
3.1.3.4. Condom use behavior of female sex workers before intervention
Table 3.9. Condom availability in 2005-2006
Rate of PNBD
% | p | |||
General (n=499) | BDDP (n=275) | BDNH (n=224) | ||
Ever used condom | 99.0 | 98.5 | 99.6 | 0.39 |
Can have BCS < 15 minutes | 97.8 | 97.5 | 98.2 | 0.82 |
Know that at the reception condoms available | 80.6 | 78.2 | 83.5 | 0.24 |
Bring condoms when interviewed | 2.0 | 3.3 | 0.4 | 0.03 |
Table 3.9 shows that 99% of FSWs had ever used condoms and 97.8% of FSWs had condoms within 15 minutes (97.5% of the FSW group and 98.2% of the FSW group). About 80% of FSWs' reception facilities had condoms available (78.2% of the FSW group and 83.5% of the FSW group). However, only a very small number (2%) of FSWs had condoms with them when interviewed.
Table 3.10. Percentage of PNBD knowing condom supply locations
Condom supply location
General (n=499) | BDDP (n=275) | BDNH (n=224) | p | ||||
SL | % | SL | % | SL | % | ||
Pharmacy | 456 | 91.4 | 254 | 92.4 | 202 | 90.2 | 0.38 |
Peer | 167 | 33.5 | 105 | 38.2 | 62 | 27.7 | 0.01 |
Medical facility | 62 | 12.4 | 43 | 15.6 | 19 | 8.5 | 0.02 |
Bar, restaurant, hotel | 141 | 28.3 | 72 | 26.2 | 69 | 30.8 | 0.25 |
According to Table 3.10, 91.4% of FSWs know that they can buy condoms at pharmacies. 33.5% of FSWs know that they can get condoms through peer educators, 28.3% think that they can get condoms at bars, restaurants, hotels and 12.4% at health facilities.