Awareness of Professional Testing Activities at Luc Nam District Secondary School
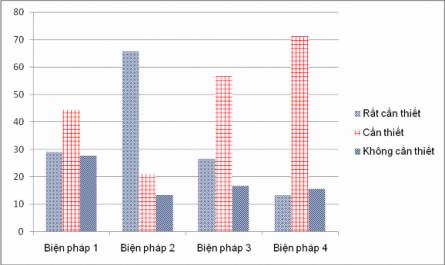
Who are teachers. This shows that the Centers for Professional Development understand the importance of professional development work more than the Board of Directors and teachers. At the level of very necessary assessment, 10/40 leaders of the Center for Professional Development assessed that ...