Group 3. Functional workers ensuring business conditions of tourism enterprises: These are people who do not directly provide products and services to customers. Their main task is to provide necessities and working means for workers in other departments of the tourism enterprise.
Group 4. Direct workers providing products and services in tourism businesses: These are workers who directly participate in the tourism business process, directly providing services and serving tourists.
Thus, for the labor component of state management function on tourism and labor function of tourism career, the expert subjects have been surveyed to establish a set of criteria for assessing provincial competitiveness in the official tourism sector. Therefore, the model testing in this study selected the sample subjects as tourism enterprises, specifically the 4 groups of labor in tourism enterprises as presented above.
4.2.5. Sampling range
Maybe you are interested!
-

 Reliability Testing of Dependent Variable Scale
 -
 Reliability Testing Using Cronbach'S Alpha Coefficient
 -
 Testing of Scales – Cronbach'S Alpha Reliability Coefficient.
 -
 Strengthening Testing, Evaluation, Competition and Reward Activities in Life Skills Education for Primary School Students
 -
 Results of Reliability Test of Independent Variables Scale
However, within the framework of this study, to assess provincial competitiveness in the tourism sector using a model method, a pilot survey will be conducted in Ba Ria - Vung Tau province with the subjects being tourism businesses operating in Vung Tau city, Ba Ria city, Chau Duc district, Tan Thanh district, Xuyen Moc district, Long Dien district, Dat Do district and Con Dao district (See Appendix 6 for details).
4.2.6. Investigation method
Each questionnaire was developed solely for the purpose of this study. A panel of experts comprising researchers in the tourism field reviewed and revised the questionnaires. They were then pilot tested with a series of interviews with a specified sample size. A reliability test based on Cronbach’s Alpha value was conducted to continue asking questions until the required sample size was achieved.
4.3. Sample description
The official quantitative survey was conducted in Ba Ria - Vung Tau from August 2013 to August 2014, with an initial sample size of N = 165.
The result was 180 ballots were distributed, 15 ballots were lost, and 165 ballots were collected. Of the 165 ballots collected, 15 were rejected, specifically: 7 ballots were not answered completely and 8 ballots were answered in duplicate. Thus, the number of rejected ballots was 30 with a rate of 8% and the number of accepted ballots was N.
= 150 (See Appendix 7 for details). The sample analysis results are described as follows:
Group 1. General management workers of tourism businesses: 21 people, accounting for 14%;
Group 2. Management workers in economic operations in tourism enterprises: 36 people, accounting for 23%;
Group 3. Functional workers ensuring business conditions of tourism enterprises: 38 people, accounting for 25%;
Group 4. Direct workers providing products and services in tourism businesses: 66 people, accounting for 43%;
4.4. Cronbach'Alpha reliability test
4.4.1. Testing the reliability of variables measuring input factors and tourism attractiveness
The Cronbach's Alpha test result of the scale of input factors and tourism attractiveness = .768 > .60 meets the standard and the 5 measurement variables have total correlation coefficients greater than .03, meeting the quality: VA1. Natural resources
= .709, VA2.Cultural resources= .676, VA3.Safety and security= .583, VA4.Health and hygiene= .527, VA5.Price competitiveness in tourism industry
=.664. (see Appendix 8 for details).
4.4.2. Testing the reliability of variables measuring resources for tourism development
The Cronbach's Alpha test result of the scale of resources serving tourism development = .774 > .60 meets the standard and the 4 measurement variables have total correlation coefficients greater than .03, meeting the quality: VB1.Infrastructure = .706, VB2.Resource conditions = .689, VB3 = .621. Business capacity of enterprises, VB5. Number of tourism clusters/industries = .590. VB4. Number of local competent suppliers does not meet the quality with total correlation coefficient = .143 < .03 is eliminated (see Appendix 9 for details).
4.4.3. Testing the reliability of variables measuring local government capacity
The Cronbach's Alpha test result of the local government capacity scale = .772 > .60 meets the standard and 4 measurement variables have total correlation coefficients greater than .03, meeting the quality: VC2. Regulations on policies and strategies for tourism = .725, VC3. Relationships of cooperation in tourism development = .660, VC4. Application of e-commerce in tourism = .620, VC5. Structure of tourism supply chain = .612 and 1 measurement variable does not meet the standard: VC1. Brand building = .127 (see Appendix 10 for details).
4.4.4. Testing the reliability of variables measuring factors affecting the tourism market
The Cronbach's Alpha test result of the scale of factors affecting the tourism market = .798 > .60 meets the standard and the 5 measurement variables have total correlation coefficients greater than .03, achieving quality VD1 respectively. Tourism demand =
.645, Example 2. Travel motivation = .594, Example 3. Tourism level = .539, Example 4. Tourist awareness = .607; Example 5. Business awareness = .618 (see Appendix 11 for details).
4.4.5. Testing the reliability of variables measuring provincial competitiveness in the tourism sector
The Cronbach's Alpha test result of the provincial competitiveness scale in the tourism sector = .684 > .60 meets the standard and the 3 measurement variables have total correlation coefficients greater than .03, achieving quality as PCT1 = .640, PCT2 =
.641, PCT3 = .668 (see Appendix 12 for details).
Thus, initially, 23 variables measuring 5 main factor groups were included in the Cronbach's Alpha test. The test results showed that 2 variables VB4 and VC1 had a total variable correlation coefficient of less than .03 that did not meet the quality standards and were eliminated, while 21 variables measuring 5 main factors had a total variable correlation coefficient of greater than .03 that met the quality standards and were left.
In the next section, we will only perform exploratory factor analysis (EFA) on the 18 variables measuring the four main factors.
4.5. Exploratory factor analysis EFA
4.5.1. Testing the suitability and correlation of variables
In the representative measurement variable, the KMO value = .878 satisfies the condition .50 < KMO <1, meaning that exploratory analysis is appropriate for actual data, and the Bartlett test of Sphericity has a Sig. value = .000 < .05, meaning that the measurement variables have a linear correlation with the representative factor (see Appendix 13 for details).
4.5.2. Testing the level of explanation of measured variables for factors
The percentage of variance extracted is 60.964% > 50%. This means that 67.534% of the variation in the factors is explained by the variables measuring the components of the factors (for details, see Appendix 14).
4.5.3. Rotate the elements
Select the Varimax rotation method to rotate factors with the factor loading coefficient of each item greater than .50 to meet the requirements (see Appendix 15 for details), specifically:
Group A. The input factors and tourism attractiveness have factor loadings of: VA1 = .756, VA2 = .782, VA3 = .355, VA4 = .618, VA5 respectively.
=.800. There is 1 VA3 factor that does not meet the requirements and is eliminated.
Group B. The resources serving tourism development have factor loading coefficients respectively: VB1 = .804, VB2 = .809, VB3 = .735, VB5 = .719, all are greater than
.50, passed.
Group C. Local government capacity has factor loadings of: VC2 = .873, VC3 = .801, VC4 = .824, VC5 = .776, all greater than .50, meeting the requirements.
Group D. The factors affecting the tourism market have factor loading coefficients respectively: VD1 = .750, VD2 = .741, VD3 = .723, VD4 = .698, VD5 = .673, all of which are
greater than .50, meets requirements.
Initially, 18 factors were rotated, and the result was that 1 factor VA3 did not meet the requirements and was eliminated. Thus, the remaining 17 factors that met the requirements will continue to be tested for normal distribution.
4.5.4. Test for normal distribution
According to Muthen and Kaplan (1985), if the S (kurtosis) and K (kurtosis) values are in the range [-1;+1], the data follows a normal distribution. The results of the evaluation of 17 variables, including 1 variable VD2 with S value = .236 and K value = .282 outside the range [-1;+1) failed to pass and was eliminated. Therefore, the ML maximum likelihood estimation method in the measurement model was used (see Appendix 16 for details).
Thus, 4 groups of factors measured by 16 component factors will be included in the confirmatory factor analysis CFA in the critical measurement model.
4.6. Confirmatory factor analysis CFA
Using AMOS software to analyze confirmatory factor CFA through the Saturated Model of 16 variables measuring 4 main factor groups (See Appendix 20 and Appendix 21 for details) with a confidence level of 95% or a significance level of 5%, the estimated results are as follows:
a) Overall Assessment: Measurement model has Chi-square = 420.444; Df = 98; P = .000 < .050; Chi-square /df = 4.290 < 5; GFI = .866
> 800; TLI = .858 > .800; CFI = .884> .800; RMSEA = .097 > .080 so the model
relatively consistent with market data.
b) Composite reliability and variance extracted: The results show that the measured variables have composite reliability = .867 > .60 and total variance extracted = .64 > .50, meeting the requirements (Joreskog, 1971; Fornell and Larker, 1981).
c) Unidimensionnality: The measurement model is compatible with market data and there is no correlation between the errors of the measured variables, so it achieves unidimensionality (Steenkamp and van Trijp, 1991).
d) Discriminant validity: All major concepts achieve discriminant validity because the measurement model has correlation coefficients between the components of a major concept all < 1 (Anderson and Gerbing, 1988).
e) Convergent validity: The estimated unstandardized factor weights are all positive, indicating that the concepts are all positively related and the P values are all < .05, meaning that the concepts are all statistically significant and achieve convergent validity with the estimated standardized factor weights having values > .50 (Anderson and Gerbing, 1988).
f) Theoretical validity: The results of estimating the parameters show that these relationships all have statistical value (P < 5%) allowing us to conclude that the measurement scales of the concepts in the model have theoretical validity because each measurement is closely related to other measurements as expected theoretically (Churchill 1995, p.535).
4.7. Testing the provincial competitiveness model in the tourism sector
4.7.1. Quantitative provincial competitiveness model in tourism sector
Chi - square = 614.138; DF = 143; P = .000; Chi - square/df = 4.295;GFI = .853; TLI = .835; CFI = .862; RMSEA = .097.
.72
e1
e2
-.21
e4
VA1
VA2
VA4
.72
.25
.50
.75
.85
.85
A
e5 VA5
e6 VB1
e7 VB2
.57
.69
.66
.83
.81
.00
.53
.20
e8
e10
.45
VB3
.44
VB5
.66
.67
B
z2
.16
.15
.83
z1
.69
PCT
.79
.71
.62
PCT3 e23
.51
PCT2 e22
e12
e13
VC2
VC3
.79
.60
.89
.77
z3
.00
.09
.72
.52
PCT1 e21
e14
e15
VC4
VC5
.50
.43
.70 C
.65
.31
e16
e18 e19
Example 1
Example 3
Example 4
.68
.26
.53
.73
.72
.82
.51
D
.09
e20
Example 5
.52
Figure 4.3. Quantitative provincial competitiveness model in the tourism sector. Source: Author (2014)
In which: PCT. Provincial competitiveness in the tourism sector; A. Input factors and tourism attractiveness; B. Resources for tourism development; C. Capacity of local authorities; D. Factors affecting the tourism market. The corresponding standardized regression weights are .53; .15; .09; .31 with the following specific meanings:
A. Input factors and tourism attractiveness have positive standardized regression weights = .53, positively related to PCT, that is, when B, C, D remain unchanged, if A increases by 1 point, PCT increases by an average of .53 points;
B. The resources serving tourism development have a positive standardized regression weight = .15, a positive relationship with PCT, that is, when A, C, D remain unchanged, if B increases by 1 point, PCT increases by an average of .15 points;
C. The capacity of local government has a positive standardized regression weight = .09 and is positively related to PCT, that is, when A, B, D, remain unchanged, if C increases by 1 point, PCT increases by an average of .09 points;
D. Factors affecting the tourism market with positive standardized regression weight = .31 have a positive relationship with PCT, that is, when A, B, C remain unchanged, if D increases by 1 point, PCT increases by an average of .31 points.
4.7.2. Results of estimating factors in the provincial competitiveness model in the tourism sector
The results of estimating 4 main groups of factors and 16 component factors in the provincial competitiveness model in the tourism sector are evaluated in terms of their position, importance and level of contribution, specifically:
a) For the four main groups of factors assessing provincial competitiveness in the tourism sector, see Figure 4.2, below.
Group A. Input factors and tourism attractiveness ranked 1st with a contribution rate of 49%;
Group B. Resources serving tourism development ranked 3rd with a contribution rate of 14%;
Group C. Local government capacity ranked 4th with a contribution rate of 8%.
Group D. Factors affecting the tourism market ranked second with a contribution rate of 29%.
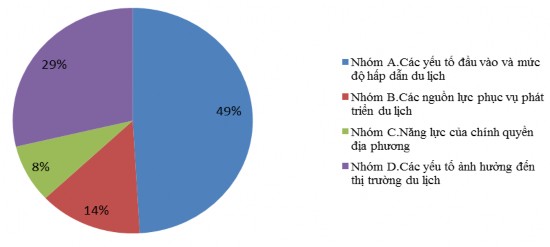
Figure 4.4. The importance of the four main quantitative factor groups. Source: Author (2014)
b) For 16 components: Regulations on policies and strategies for tourism planning 1|8.91; Cultural resources 2|8.51; Natural resources 3|8.49; Infrastructure 4|8.29; Tourism demand 5|8.22; Resource conditions 6|8.14; Tourism development cooperation relationships 7|7.73;
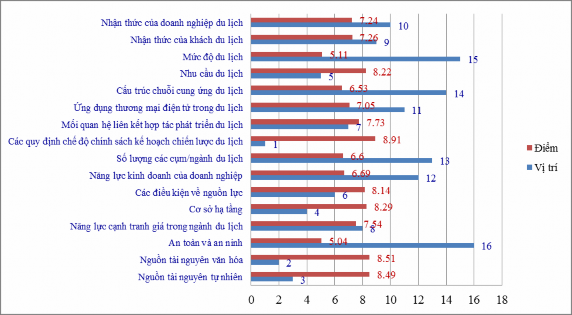
Figure 4.5. The importance position of 16 quantitative components. Source: author (2014)
Price competitiveness in tourism industry 8|7.54; Tourist awareness 9|7.26; Tourism business awareness 10|7.24; E-commerce application in tourism 11|7.05; Business capacity of enterprises 12|6.69; Number of tourism clusters/industries 13|6.6; Tourism supply chain structure 14|6.53; Tourism level
Schedule 15|5.11; Safety and Security 16|5.04, see Figure 4.3, above.