research in the world such as EFA exploratory factor testing, Cronbach Alpha reliability coefficient testing, Pearson correlation testing, Common Method Variance testing, CFA confirmatory factor testing, SEM linear structural model testing, bootstrapping analysis and evaluation of indirect effects, Independent Sample T-test/ One-way Anova multi-group testing. With the achieved results, the author hopes to be able to suggest policy implications and development orientations for higher education development institutions in the current context.
3.2.2. Research process
The basic research process includes the following steps: (1) Building a theoretical basis; (2) Building a theoretical research model and scale; (3) Assessing the reliability of the model and scale with preliminary research, thereby standardizing the content of the questionnaire (preliminary research sample N=150); (4) Official research with a sample size of N=1368; (5) Checking the reliability and value of the official scale; (6) Testing the research hypothesis with the SEM linear structural model; (7) Assessing indirect effects; (8) Descriptive statistics and multi-group testing. Details of the research process and applied methods are described in detail in Figure 3.1.
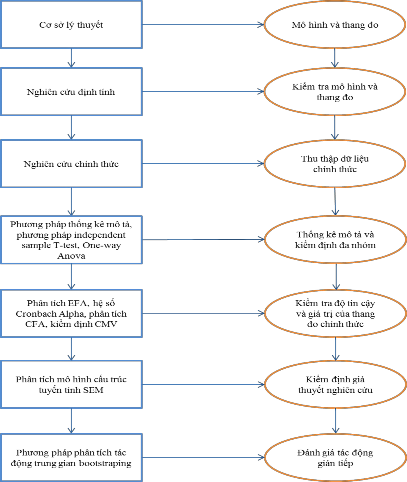
Figure 3.1. Research process
3.2.3. Sampling and data collection methods
3.2.3.1. Quantitative research sampling method
Because the scope of the research topic is relatively broad, the main survey subjects are all students studying at public universities in the field of economics and business administration in Vietnam. According to the author's statistics, there are currently 81 public universities that train majors related to economics and business administration. Therefore, it would be relatively difficult to collect data from all 81 schools. Furthermore, many schools, although training majors in the economics and business administration group, have small quotas, not many students, and training in this group of majors is not the school's strength. Therefore, the subjects selected for the survey sample will be narrowed down through standards to ensure the value of the research. The universities selected for the survey sample will need to meet the following basic criteria: (1) The school's enrollment quota in recent years for majors in economics and business administration must be greater than 50%. (2) The school needs to have a strategic mission/vision and development orientation focusing on training in economics and business administration; (3) The number of training majors related to economics and business administration of the school must be greater than 50% of the total number of majors. In this study, determining the overall sample size is relatively difficult, although the Ministry of Education and Training has statistics on the number of students studying at university levels, however, details on the number of students studying at public universities in economics and business administration are unclear. Therefore, to determine the minimum sample size, the author applies the recommendations for determining sample size in cases where the overall sample size is large and cannot be determined according to the studies of Hair et al. (2010), Nguyen Thi Tuyet Mai and Nguyen Vu Hung (2015) and Nguyen Dinh Tho (2014). Accordingly, the research sample size is determined based on the formula:

In there:
n: number of samples to be determined (sample size)
Z: The value of the Z distribution table depends on the selected confidence level. Usually, the confidence level is chosen to be 95%, the Z value = 1.96.
To ensure that n estimates have the safest magnitude, choose p = 0.5
e: allowable error. Selectable e = ± 0.01 (1%), ± 0.05 (5%), ± 0.1 (10%).
Based on the above formula, with the allowable error value of e = ± 0.05 (5%), the minimum sample size is 384.
In this study, regression analysis is used as the main method to assess the impact of service quality and value on student satisfaction.
Students studying at public universities of economics and business administration in Vietnam.
In addition, according to Tabachnick and Fidel (2013), to conduct the best regression analysis, the minimum sample size should be 8m + 50 or more (where m is the number of independent variables in the research model). Meanwhile, Green (1991) suggested that the minimum sample size for regression analysis is 50 + m (m is the number of independent variables). It can be seen that there is a diversity of sampling methods in quantitative research and there is no specific consensus. In this study, the author applied the sampling method of Hair et al. (2010), according to which the minimum sample size will be 5 times the number of observed variables in the scale. Therefore, based on the proposed research scale including 47 observed variables, the minimum sample size will be 47x5=235. Thus, compared with some sampling methods for quantitative analysis in this study, the sample size is completely appropriate.
Thus, through the analysis of the research context and the overall sample size, along with the limitations of resources and time to conduct the research, it is relatively difficult to build a research sample that ensures proportional representation of the overall sample. However, through the analysis of the method of selecting the minimum sample size when the overall sample size is not clearly known and the basic conditions for implementing the regression analysis method, the author decided to build a research sample through a survey of 1,360 students from 12 public universities of economics and business administration in Vietnam. The author believes that the representativeness of the research sample is partly demonstrated through the following characteristics:
(1) The list of 12 selected universities are all universities with large training scale in economics and business administration and have a long tradition of training in this field.
(2) The selected universities all come from localities that play an important role in building a university network with key regions and strategies and development orientations focusing on economic and business administration sectors.
(3) The research sample has diverse characteristics according to year of study, level of interest in majors and was collected at both autonomous and non-autonomous public universities.
However, to ensure statistical significance and reliability of the study, the author decided to build an initial research sample of 1,360 respondents.
For students, the study only surveyed students in the 2nd, 3rd and 4th years because the 1st year students have not experienced the service for long, so their level of perception is not high. Based on the criteria used to determine the universities to conduct the survey. The universities selected by the author include.
Table 3.5. Summary of information on universities conducting surveys and selection criteria
SCHOOL
TC1 | TC2 | TC3 | |
1. University of Commerce | 3675/4100 (89.63%) | “To become a center for domestic and international research and cooperation; to transfer science, technology and knowledge with high prestige in the field of modern national and international economics and trade” | 19/21 (90.48%) |
2. University of Economics | 5420/5800 | “To become one of the top 100 universities in Asia in the field of economics, | 49/53 |
National | (93.45%) | Management and business administration according to international ranking standards" | (92.45%) |
3. Foreign Trade University | 1445/2035 (71.01%) | “The mission of Foreign Trade University is to train talents and provide high-quality human resources in the fields of economics, business, and administration. business, finance - banking,…” | 20/25 (80.00%) |
4. Academy of Finance | 4200/4400 (95.45%) | “Build and develop the Academy of Finance into a training and research center "The leading scientific research center in Economics - Finance - Accounting in Vietnam, with prestige in the region" | 21/22 (95.45%) |
5. Banking Academy | 2105/2450 (85.92%) | “Best meet the training needs of individuals, employers and society with about 15 training majors in the field of applied economics; is One of the leading universities in finance and banking training" | 13/15 (86.67%) |
6. University of Economics, VNU | 1200/1200 (100%) | “Providing society with high-quality human resources in a professional orientation experts, leaders in the fields of economics, management and business administration to meet the needs of quality, effective and sustainable development of Vietnam…” | 6/6 (100%) |
“Creating an advanced academic environment to promote discovery, application, | |||
7. University of Economics - University of Danang | 3175/3400 (93.38%) | transfer of economic and management scientific knowledge, ensure the foundation for success and lifelong learning capacity for learners, nurture and develop talent, Addressing socio-economic challenges for the prosperous development of | 16/18 (88.89%) |
community". | |||
8. Ho Chi Minh City University of Economics | 5000/5500 (90.91%) | “By 2025, UEH will become a prestigious multidisciplinary university in Southeast Asia. UEH's position is the No. 1 university in Vietnam in economics, business, business, law and technology”. | 44/50 (88.00%) |
“By 2030, Hue University of Economics will become a training institution | |||
9. University of Economics - | 1830/1830 | creation, scientific research, technology transfer and service provision in the field | 22/22 |
Hue University | (100%) | The field of economics and management has quality and prestige, ranked in the top 10 training institutions. | (100%) |
leading economics and management in Vietnam". | |||
10. University of Economics | “In terms of vision, by 2030, University of Economics and Business Administration | ||
and Business Administration | 1470/1600 | is an applied university in the fields of economics, business, | 23/25 |
Business - University | (91.88%) | management and law have prestige, brand and quality, many aspects are on par with | (92.00%) |
Thai Nguyen | top universities in the country and in Southeast Asia". | ||
11. University of Finance - Marketing | 4300/4500 (95.56%) | “Building the University of Finance and Marketing to become a leading university and postgraduate training, scientific and technological research institution in the country and reputable in the region". | 26/27 (96.30%) |
“The University of Labor and Social Affairs is the only public higher education institution | |||
The best of the Labor, Invalids and Social Affairs sector in training highly qualified human resources according to the | |||
12. Lao University | 2800/3750 | Application orientation with strengths in Human Resource Management, Social Work, | 5/8 |
Dynamic – Society | (74.67%) | Insurance, Accounting and Business Administration; is a center for scientific research, | (62.50%) |
technology transfer, international cooperation in the field of economics - labor - society | |||
"The association meets the development requirements of the industry, the country and international integration". |
Maybe you are interested!
-

 Summary of Information on the Subject's Capacity and Training Level
 -
 Developing mobile information service activities at Vietnam Posts and Telecommunications Group by 2020 - 1
 -
 Business development of mobile information service enterprises in Vietnam - 23
 -
 Perfecting the accounting information system in public universities in Vietnam - 1
 -
 Proposing Solutions for Training Management of Bachelor of Information Technology to Meet Social Needs at Vietnamese Universities
Note: TC1: Training target for Economics and Business Administration in 2020/Total target; TC2: Having a mission/strategic vision/strategic goal for developing training in Economics and Business Administration; TC3: Number of training majors in Economics and Business Administration compared to the total number of majors;
Source: Author's synthesis
3.2.3.2. Data selection and collection methods
Methods of selecting and collecting secondary data
In the study, the data collected includes secondary data and primary data. For secondary data, the author collected through reliable sources such as reports of the Ministry of Education and Training, enrollment information from university homepages, analytical and evaluation articles from magazines from reputable publishing agencies and under the management of the Ministry of Information and Communications. In addition, the author also exploited the results from past studies on service quality, service value and student satisfaction. The data from the studies used in the thesis have clear origins and come from reputable database sources as well as reliable scientific journals.
Sampling methods and primary data collection
Primary data was used in two main stages of the research including: Qualitative research through focus group interviews (students) and in-depth interviews (experts); Quantitative research with respondents being students of public universities in economics and business administration.
Primary data for the study were collected at 12 selected public universities in the field of economics and business administration. Two collection methods include: (1) Direct interviews with the support of a team of collaborators; (2) Data collection through online surveys using Google Form software. The method of selecting a clustered sample was applied to serve multi-group testing. The clustering criteria include gender, year of study, university characteristics (autonomous and non-autonomous), level of interest in the major and level of tuition fee perception. Some criteria that are relatively difficult to classify and plan for collection in advance such as level of interest in the major and tuition fee perception will be randomly collected until the threshold for stopping collection is met. In the clustered sample groups, the convenience sampling method was applied.
Direct interview method: Direct interview method is conducted at universities in Hanoi and some universities where the author can receive support from collaborators. Collaborators will go directly to universities of economics and business administration to collect data. The time for direct interviews is during breaks between classes. Before asking questions, candidates need to confirm that they are not under any pressure when participating in the interview. Any questions about the content of the questions will be answered directly by collaborators to students participating in the questionnaire.
Collection method by online survey: This method is applied to some universities with large geographical distance from Hanoi such as Ho Chi Minh City, Da Nang, Hue. The online survey is designed using Google Form software and sent to some collaborators who are lecturers at the universities.
survey. To ensure the appearance of low-quality information, the content of the online survey is described in more detail than the direct interview survey. In which, difficult terms are explained in detail and the answer has an additional option with the content "do not really understand the question".
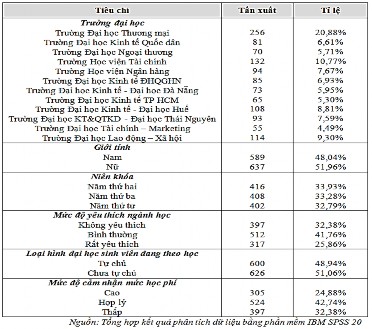
After 3 months of data collection (from September 2020 to December 2020), 1,360 questionnaires were distributed in two forms: online and in-person interviews. The number of questionnaires collected was 1,298 (reaching a rate of 95.44%). However, 101 questionnaires were missing information and had the option of "not really understanding the question". For questionnaires with no more than 2 questions and with the option of "not clear about the question content", collaborators contacted respondents and supported the completion of the unfinished content. After processing in this form, 29 questionnaires were completed and added to the research sample. Thus, the research sample consisted of 1,226 students from 12 public universities in economics and business administration. The detailed characteristics of the research sample are described in detail in Table 3.6.
Table 3.6. Description of research sample
3.2.4. Data processing method
3.2.4.1. Exploratory factor analysis EFA and Cronbach Alpha reliability coefficient
To perform EFA factor analysis, KMO and Bartlett tests were applied to check the compatibility of the research sample. In this study, Principal Axis Factoring (PAF) extraction was used. PAF extraction is commonly applied to the assumption that observed variables have their own variance (Hair et al., 2010). Meanwhile, Promax non-square rotation was used to resolve the correlations between factors. In particular, in the research model, there are some intermediate variables, so Promax rotation is considered appropriate.
more suitable. Besides, according to Anderson and Gerbing et al. (1988), PAF extraction method and Promax rotation support reflecting data structure at a higher level than Principal Components extraction with Varimax rotation.
According to Hair et al. (2010), some criteria to evaluate the level of suitability in exploratory factor analysis EFA include: (1) Kaiser-Mayer-Olkin (KMO) coefficient has a value in the range of 0.5-1; (2) Sig of Bartlett test has a value less than 0.05; (3) Eigenvalue of factors needs to be greater than 1; (4) Factor loading is greater than 0.5 and (5) Total Variance Explained is recommended to be greater than 50%.
Cronbach Alpha coefficient is applied after conducting EFA and determining factor groups. The method of reliability testing based on Cronbach Alpha coefficient is widely recognized and commonly applied to assess the reliability of scales (Rubio, 2005). Most studies suggest that a value of 0.7 is appropriate as an assessment standard (Churchill, 1979; Hair et al., 2010). Allen et al. (2014) proposed that there should be additional assessments based on the total item correlation index (Corrected item/ Total Correlation), the common standard level is that this index is greater than 0.3. Hair et al. (2010) also affirmed that attention should be paid to the Cronbach Alpha index when removing variables (Cronbach's alpha if item deleted), this index needs to be smaller than the total variable Cronbach Alpha value. In summary, from the above synthesis and analysis, the Cronbach Alpha test in this study is determined to be satisfactory if it satisfies the following contents: (1) Cronbach Alpha value is greater than 0.7; (2) Total variable correlation index is greater than 0.3; (3) Cronbach Alpha index when excluding variables is smaller than Cronbach Alpha of total variables.
3.2.4.2. Confirmatory factor analysis CFA method
Confirmation Factor Analysis (CFA) was used to assess the representativeness of observed variables for factors (Hair et al., 2010). In this study, confirmatory factor analysis (CFA) was performed by AMOS 23 software.
The author conducted confirmatory factor analysis (CFA) and evaluated based on the following two basic aspects: (1) Model fit indices; (2) Construct validity through convergent validity and discriminant validity.
+ Model fit
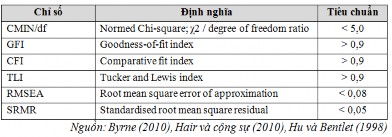
The assessment of model fit is essentially how well the model represents the data reflecting the underlying theory (Hooper et al., 2008). Model fit compares theory with reality by assessing the similarity of the observed and estimated covariance matrices (Hair et al., 2010). In this study, the author examines the model fit through common indices used in confirmatory factor analysis according to the standards of Hair et al. (2010); Byrne (2010); Hu et al. (1998). Specifically, the definition and standard values are described in detail in Table 3.7.
Table 3.7. Description of the definition and criteria of model fit indices
- Construct validity
According to Hair et al. (2010), construct validity refers to the extent to which a set of measured items truly represents the theoretical latent construct that the variables are designed to measure. Basically, construct validity assesses the precision of measurement and it is established through investigating convergent and discriminant validity (Malhotra, 2010; Westen and Rosenthal, 2003).
- Convergent validity indicates the extent to which a measure correlates with similar measures of a particular construct (Brennan et al., 2007). In addition, Hair et al. (2010) proposed to test convergent validity through three dimensions: factor loadings, average variance extracted (AVE), and composite reliability of the construct (CR). The specific criteria values are: (1) All factor loadings are greater than 0.5;
(2) Average variance extracted (AVE) is greater than 0.5;
(3) Composite reliability index CR (Composite reliability) is greater than 0.7.
- Discriminant validity is understood as “the extent to which factors are different from each other and uncorrelated with each other” (Hair et al., 2010). Fornell and Larcker (1981) proposed to evaluate discrimination based on the square root of AVE and bivariate correlation coefficients, which is also the method the author applied to evaluate discriminant validity in this study.
+ Common Method Bias
Common method variance (CMV) is known as a problem that affects measurement performance. Podsakoff et al. (2012) asserted that CMV brings dangers to the reliability and validity of measurement. Therefore, many solutions have been proposed to control the effects of CMV. Some views suggest that controls should be put in place right from the beginning of research design and data collection (Chang et al., 2010). Some other studies apply quantitative analysis models to test the possibility of CMV, the most popular are using Harman's single test, using latent common method variance factor and applying strict process control measures (Podsakoff et al., 2012).
3.2.4.3. SEM linear structural model analysis method
Structural Equation Modeling (SEM) is used to test research hypotheses in many research fields such as psychology (Anderson et al., 1988; Hansell et al., 1991), management science (Tharenou et al., 1994),