The entire value of the intermediate product will be transferred at once into the value of the new product. Each product can act as an intermediate product or a final product depending on the purpose of human use.
For example: Fresh fish, electricity, etc. to make canned fish, then the fish and electricity are intermediate products. If the fresh fish and electricity are used for cooking or for export, then the fish and electricity are final products.
Let's look at each phrase in the GDP concept.
- GDP is market value
You might think “you can’t compare apples to oranges,” but GDP does. GDP adds up a lot of different products into a single measure of the value of economic activity. To do this, it uses market prices. Since market prices represent the amount people are willing to pay for different goods, they reflect the value of those goods. If the price of an orange is twice the price of an apple, then an orange contributes twice as much to GDP as an apple.
- All
GDP attempts to be comprehensive, including all goods produced in the economy and legally sold in markets. GDP calculates the market price not only of apples and oranges but also of pears, grapes, books, movies, haircuts, medical care, etc.
GDP also includes the market value of housing services provided by the economy’s existing housing stock. For rental housing, this is easy to calculate – rent equals renter spending and landlord income. However, many people live in their own homes and therefore do not pay rent. The government accounts for owner-occupied housing in GDP by estimating its rental value. That is, GDP is calculated on the assumption that owners pay rent to themselves, so rent is included in both their spending and their income.
However, there are some products that GDP leaves out because they are too difficult to measure. GDP does not count products that are produced and sold in the underground economy. For example, illegal products. It also does not count products that are produced and consumed in the home, and therefore never reach the market. Fruits and vegetables bought at the grocery store are part of GDP, but fruits and vegetables grown in your garden that you use to cook your own food are not.
These omissions of GDP can sometimes lead to odd results. For example, when Lan pays Hoa to mow her lawn, the transaction is part of GDP. If Lan marries Hoa, the situation changes. Although Hoa continues to care for Lan’s lawn, the value of the lawn mowing activity is now taken out of GDP, because
because Hoa's services are no longer sold on the market. Therefore, when Lan and Hoa get married, GDP decreases.
- Goods and services
GDP includes both tangible goods (food, clothes, cars, etc.) and intangible services (haircuts, house cleaning, doctor visits, etc.). When you buy a CD by your favorite band, you are buying a good and the price is included in GDP. When you pay to hear a concert by the same band, you are buying a service and the ticket price is also included in GDP.
- Final
If Pamper Company produces paper, which is then used by Thanh Lan Company to make greeting cards, the paper is called an intermediate good, and the greeting cards are called final goods. GDP includes only final goods. The reason is that the value of intermediate goods is already included in the price of final goods. Adding the market value of the paper to the market value of the cards would result in double counting. That is, the value of the paper is counted twice.
- Produced
GDP includes all goods and services produced in the current period. It does not include transactions involving goods produced in the past. When Vidamico produces and sells a new car, the value of that car is included in GDP. When someone sells a used car to someone else, the value of that used car is not included in GDP.
- Within a country
GDP measures the value of production within the geographical boundaries of a country. When a Russian citizen works temporarily in Vietnam, the value of his production is part of Vietnam's GDP. When a Vietnamese citizen works in Japan, his GDP is not part of Vietnam's GDP (it is part of Japan's GDP). Therefore, products are included in a country's GDP when they are produced within the territory of that country, regardless of the nationality of the producer.
- In a certain period
GDP reflects the value of production made during a specific period of time. This period is usually a year or a quarter (3 months). GDP reflects the amount of income and expenditure during that period.
2.2.2. The relationship between the two indicators GDP and GNP
GNP and GDP are both measures of the total final product produced by a country in a period. GNP measures the output of a country on a resource basis, that is, per capita. National population
Regardless of where they live, whether in the country or abroad, the goods and services they produce are included in the GNP of that country. GDP statistics the products produced by a country within the economic territory of that country, regardless of whether they are domestic or foreign, domestic enterprises or enterprises owned by foreigners.
So GNP and GDP differ in the value of goods and services that the people of that country produce abroad and the value of goods and services that foreigners produce within the economic territory of that country. This part is called net income from assets abroad, which is the difference between the value of goods and services that the people of that country produce abroad minus the value of goods and services that foreigners produce within the economic territory of that country.
When referring to the income of an economy (say country X), it will likely include 3 sources:
A: value created by citizens of country X in the territory of country X. B: value created by citizens of country X in the territory of another country. C: value created by citizens of another country in the territory of country X. In which:
- Income A: is the value created from the production process with indigenous resources and indigenous property of country X.
- Income B: is income from export factors or also known as the value of goods and services that people produce abroad. Including: wages of workers abroad, profits from capital investment abroad, income from selling or leasing copyrights abroad.
- Income C: is income from imported factors or the value of goods and services produced by foreigners in the country. Including: wages of foreigners working in the country, income from capital ownership, copyrights of foreigners investing in the country.
Components of GDP and GNP:
GDP = A + C
GNP = A + B
Good
→ GNP = GDP + (B – C)
GNP = GDP + (
Income from the
–
export factor
Income from imported factors
)
Net Income from Aboard (NIA)
The difference between income from exported factors and income from imported factors is called net income from abroad.
NIA =
Income from the
–
export factor
Income from imported factors
= B - C
→ GNP = GDP + NIA (2.1)
If NIA > 0 then GNP > GDP: income from exported factors is greater than income from imported factors, this fact often happens to developed countries.
If NIA < 0 then GNP < GDP: income from export factors is smaller than income from import factors, this situation often occurs in underdeveloped countries.
2.2.3. Real GDP, nominal GDP and GDP deflator
2.2.3.1. Real GDP and Nominal GDP
As we have seen, GDP reflects the total value of goods and services in all markets of the economy. Let's learn about two terms: Nominal GDP (Nominal GDP - GDP n ) and Real GDP (Real GDP - GDP r ).
Nominal GDP is the total value of output of goods and services calculated at current prices.
current or the sum of the quantity of goods and services produced in a year multiplied by the prices of those goods and services in that year.
Nominal GDP is expressed in the following formula:
n
In there:
GDP t n =
Σ q t i p t i i =1
(2.2)
i: i-th final commodity with i = 1, 2, 3,…,n. t: calculation year.
q: quantity of goods and services, q i : quantity of the i-th good, ip: price of goods and services, p i : price of the i-th good
If total spending increases from year to year, then one of two things must be true: (1) the economy is producing a larger output of goods and services, or
(2) goods and services are sold at higher prices. Therefore, nominal GDP does not tell us in detail whether its increase is mainly due to an increase in prices or an increase in the quantity of goods and services produced in the economy.
In studying economic fluctuations over time, economists want to separate these two effects. Specifically, they want to have a measure of the total quantity of goods and services produced by an economy that is not affected by changes in the prices of those goods and services. To do this, economists use a measure called real GDP.
Real GDP is the value of the current output of goods and services of the economy calculated at the fixed prices of the base year or the sum of the quantity of goods and services produced in a year multiplied by the fixed price of those goods and services in the base year (base year).
Real GDP is expressed in the following formula: n
GDP t =
Σ q t i p 0 i i =1
(2.3)
Assuming t = 0 in the base year.
By measuring current output at constant historical prices, real GDP shows how an economy's overall output of goods and services changes over time.
To distinguish between nominal and real GDP, we need to find a way to separate the changes in nominal GDP due to price changes from the changes due to quantity changes. The best way to do this is to consider a simple example. Suppose we value the quantity of fish sauce produced in 2013 using the price of fish sauce in 1994. We then compare the value of fish sauce production in 2013 with the value of fish sauce production in 1994. Only the quantity is different because we have benchmarked both years using the price of fish sauce in 1994. We can repeat this calculation for all the years of interest by multiplying the quantity of fish sauce in each year by the price of fish sauce in 1994. The year 1994 is known as the base year.
Similar to what we did with fish sauce above, we calculate for all the goods produced in the economy. We take the quantity of all final goods in a particular year, multiply it by its price in the base year, and add the values together. The result is real GDP or GDP at constant prices. This is sometimes called inflation-adjusted GDP because it eliminates the effect of price changes by using the constant prices of the base year for all other years.
For each individual product, the quantity in 2013 may be larger or smaller than the quantity in 1994, but when we calculate real GDP, we get an indication of whether the total output of the economy increased or decreased.
We use 1994 as the base year in the example because articles and statistics on Vietnam's GDP are using 1994 as the base year. The General Statistics Office occasionally changes the base year, previously 1990 was the base year for calculating statistics on GDP, expenditure and income of the economy.
The goal of our GDP calculation is to capture the performance of the entire economy. Since real GDP reflects the amount of goods and services produced
in the economy, so it also shows the ability to satisfy the needs and wants of people in the economy. That is why real GDP is a better indicator of economic welfare than nominal GDP.
After eliminating the effects of price changes, economists calculate the economy's growth rate (GDP growth rate – g), which is the percentage change in real GDP from this period/year to the previous period/year.
GDP t - GDP t- 1 r
g t =
GDP t-1 r
x 100% (2.4)
2.2.3.2. GDP Deflator (GDP Deflator – D GDP )
The GDP deflator measures the average price level of all goods and services included in GDP. The GDP deflator is calculated as the ratio of nominal GDP to real GDP. It reflects current prices relative to prices in a base year.
The GDP deflator in later years reflects the increase in nominal GDP compared to the base year. It only shows the change in output due to price changes, not the increase in real GDP.
Since nominal GDP and real GDP in the base year are equal, the base year GDP deflator is always equal to 1. However, for convenience, they are often expressed as 100% instead of 1. Thus, the ratio between the value of nominal GDP and real GDP is multiplied by 100%.
The formula for calculating the GDP deflator is as follows:
GDP t
GDP =
GDP t
x 100% (2.5)
We can illustrate the above with a simple example, that is, studying an imaginary economy that produces only two final goods, rice and fish sauce. We will find out how to calculate the indicators of nominal and real GDP (GDPn, GDPr), the GDP deflator (D GDP ) and the GDP growth rate or the annual growth rate of the economy (g).
Year
Rice | Fish sauce | Target (thousand) | |||||
Price (thousand/kg) | Quantity (kg) | Price (thousand/liter) | Amount (liter) | GDP n | GDP r | D GDP | |
2011 | 13 | 1000 | 17 | 180 | 16,060 | 16,060 | 100 |
2012 | 14 | 1200 | 17.5 | 190 | 20,125 | 18,830 | 106.87 |
2013 | 15 | 1350 | 18 | 210 | 24,030 | 21,120 | 113.78 |
Maybe you are interested!
-
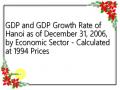
 GDP and GDP Growth Rate of Hanoi as of December 31, 2006, by Economic Sector - Calculated at 1994 Prices
 -
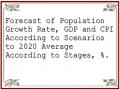 Forecast of Population Growth Rate, GDP and CPI According to Scenarios to 2020 Average According to Stages, %.
 -
 Consistent Policy of Encouraging Private Economic Development, Increasing Contribution of Private Economy in GDP and State Budget Revenue
 -
 Construction. Currently, the General Department of Taxation has issued guidelines for calculating the construction industry's GDP according to four product groups: Housing; Non-residential civil works; Manufacturing factories.
 -
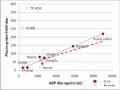 The Relationship Between Vehicle Ownership and GDP Per Capita (Usd)
r
GDP 2013 r - GDP 2012
g 2013 = x 100%
GDP 2012
21,120 - 18,830
=
18,830
x 100%
= 12.16%
2.2.4. The meaning of GNP and GDP indicators in macroeconomic analysis
Countries always seek to measure their performance in a given period. A country's economic performance reflects how many products it produces and how well it uses its factors of production to create products that serve the lives of its people.
GNP and GDP are good measures of a country's economic performance. The World Bank or the International Monetary Fund as well as economists often use these indicators to compare the production scale of different countries in the world. After calculating, GNP and GDP figures are converted into different currencies of different countries and US dollars. That conversion is done through the official exchange rate between countries and US dollars.
GNP and GDP are often used to analyze changes in a country's output over different periods of time. In this case, real GNP or GDP is often calculated to eliminate price fluctuations.
GNP and GDP indicators are also used to analyze changes in people's living standards. To do that, people often calculate GNP and GDP per capita.
GDP per capita = GDP/total population GNP per capita = GNP/total population
Thus, the standard of living of a country depends on the quantity of goods produced and the size of its population. Changes in GDP and GNP per capita depend largely on the rate of population growth and labor productivity. The standard of living of a country depends on how the country solves the problem of population in relation to labor productivity.
Because GNP includes GDP and net income from assets abroad, GNP per capita is a better measure of the amount of goods and services each person in that country can buy. GDP per capita is a better measure of the amount of goods and services produced per person.
Governments of countries around the world must rely on GDP and GNP data to develop short-term and long-term economic development plans and strategies.
2.3. METHOD OF DETERMINING GDP
2.3.1. Macroeconomic circulation diagram
Let us imagine an economy that produces only one good, bread, from a single input, labor. Figure 2.1 illustrates all the economic transactions that occur between households and firms in this economy.
Spending
Commodity market
Income
Business
Household
Factor market
Figure 2.1: Macroeconomic circulation diagram
The outer branch of Figure 2.1 shows the flow of goods and inputs (labor). Households sell labor to firms, which use workers’ labor to produce goods, which they then sell to households. Thus, labor flows from households to firms, and goods flow from firms to households.
The inner branch of Figure 2.1 shows the corresponding cash flows. Households buy goods from firms. Firms use some of the sales revenue to pay wages to workers. The rest is profit for the owners of the firms (who are themselves part of the household sector). So expenditure on goods flows from households to firms, while income in the form of wages and profits flows from firms to households.
GDP reflects the flow of money in the economy. We can calculate it in two ways:
- GDP is the total income earned from the production of goods. It is equal to the sum of wages and profits (ie the money circulation in the lower part of Figure 2.1) (Method of determining GDP by income flow or cost method)