In 2006, our country only reached 41.25%; according to the General Statistics Office's sub-sector, the margin was expanded to 31.20%. Thus, according to the two sub-sector methods in region III in our country, there was a difference of about 10%. Although the construction industry was added to region III, the proportion compared to other countries in the region was still low. The problem for this region is to find a solution to promote faster growth compared to the other two regions and narrow the gap with other countries in the region.
Table 2.18: Growth rate of region III and GDP of Vietnam, Japan, Korea and Taiwan (%)
Country/Region
Time | Growth rate of region III (A) | GDP growth rate (B) | Difference: (A): (B) times | |
Vietnam | 1991- 2004 | 6.99 | 7.48 | 0.93 |
Vietnam * | 1991- 2004 | 7.63 | 7.48 | 1.02 |
Japan | 1950s | 8.80 | 8.00 | 1.10 |
1960s | 11.50 | 10.90 | 1.05 | |
1970s | 5.50 | 5.00 | 1.10 | |
Korea | 1950s | 3.70 | 5.10 | 1.73 |
1960s | 8.90 | 8.60 | 1.03 | |
1970s | 8.50 | 9.50 | 0.89 | |
Taiwan | 1950s | 10.00 | 7.60 | 1.32 |
1960s | 9.10 | 9.60 | 0.95 | |
1970s | 8.30 | 8.80 | 0.94 |
Maybe you are interested!
-
 GDP and GDP Growth Rate of Hanoi as of December 31, 2006, by Economic Sector - Calculated at 1994 Prices
 -
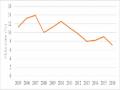
 Vietnam GDP Growth Rate Chart
 -
 Vietnam - Japan economic and trade relations in the international context. Current situation and solutions - 1
 -
 Economic Growth Rate of Thua Thien Hue Province in the Period 2005 - 2016
 -
 The Integration Process Creates a New, More Dynamic Economic Environment Serving the Growth Process and Gradually Shifting the Economic Structure
Vietnam *: According to the United Nations sectoral classification Vietnam: According to the Vietnam Statistics sectoral classification Source: 2007 Statistical Yearbook
Through the table above, the service sector had a lower growth rate than the NICs group in the 1960s, a period of rapid economic growth. Comparing the period 1991-2004, according to the United Nations standard, the service sector reached 7.63%, a higher growth rate than the Vietnamese standard of 6.99%. In the 1950s, the NICs group had a growth rate of 8.8% in Japan, higher than Korea in the 1950s at 3.7% and lower than in the 1960s at 8.9%, Taiwan at 9.1%. Thus, the growth rate of sector III in our country was low and not
higher than region I and the goal of becoming an industrialized country by 2020 is a big challenge.
Therefore, it is necessary to increase the proportion of sector III, because a developed economy and a country considered to be industrialized and modernized is shown when the service sector accounts for the highest proportion in the economy. The renovation has really opened the door for economic development, the structural shift in the service sector depends on a number of basic factors such as: the speed of economic liberalization and openness of the country; the level of economic development; the diversity of economic components.
In terms of quantity, the difference in the two classifications above shows that, according to the United Nations' sectoral classification, it is easy to see that the proportion of the service sector will increase thanks to the contribution of the construction sector added to the service sector, which will have an impact on the economic restructuring. One of the reasons for the slow growth of sector III is the global financial crisis. The financial, credit and insurance sectors have developed slowly and accounted for a low proportion of the entire sector. The weakness in marketing capacity and research on economic information growth has caused many difficulties for the development of this sector.
In the integration trend, to accurately assess the shift of this sector in the economy compared to other countries in the region, Vietnam should aim to use the United Nations' sectoral classification. In fact, the service sector in recent years has grown more slowly than the other two sectors; therefore, it is necessary to aim to build a block of high-quality and efficient service sectors, which is considered a central task in the economic development strategy in our country. The proportion of the service sector growing higher than the other two sectors is strong in the national economy, so solutions are needed.
synchronous, specific, immediate and long-term to exploit the potential and strengths of this region.
2.4. Shift in labor structure between sectors in the economy
2.4.1. According to the sub-sector of the General Statistics Office
Social division of labor and economic structure are two important characteristics to evaluate the production level of an economy. According to 2007 statistics, the shift in labor structure by economic sector is not as positive as the shift in GDP structure.
During this period, the total number of agricultural workers increased from 21.5 million in 1990 to 23.8 million in 2007, an average increase of 340 thousand workers/year, an increase of 1.3%/year and accounting for 43.8% of the total increase in workers; agricultural workers accounted for the largest proportion, up to over 80%. Within the sector, agricultural and forestry workers accounted for the highest proportion, about 55%.
The industry and construction sector had 3.3 million workers in 1990, increasing to 8.8 million in 2007, an average increase of 141 thousand workers/year, an increase of 3.2%/year and accounting for 18% of the total increase in the number of workers. The trend of the proportion of labor increasing less and the proportion of GDP increasing more shows that the growth of industry and construction is associated with more capital intensity than labor intensity. The labor structure within the industry has little significant change in the direction of gradually shifting from traditional light industries to modern industries. Within the construction and service sector, the processing industry accounts for the highest proportion of about 12% and the construction industry about 4.3%.
For the service sector, from 4.6 million workers in 1990 increased to 11.5 million in 2007, an average increase of 295 thousand workers/year, an increase of 4.5%/year and accounting for 30.8% of the total increase in the number of additional workers. The additional workers are still in the traditional service sector, increasing fastest in the fields of commerce,
Hotels, restaurants, transportation... On the other hand, the increase in labor in the service industry is mainly in the private economic sector, small and medium enterprises, with little capital, attracting many workers.
Thus, the increase in labor in the agricultural sector is 1.2 times higher than that in the service sector and 2.4 times higher than that in the industrial and construction sectors. Although the proportion of labor in the agricultural sector has decreased, the absolute number has still increased, although the increase has a tendency to decrease significantly; the labor structure has shifted to economic sectors unbalanced.
Table 2.19: Labor structure by industry of the General Statistics Office (%)
Branch
1990 | 1995 | 2000 | 2003 | 2004 | 2006 | 2007 | |
Agriculture, forestry and fishery | 73.02 | 71.14 | 68.24 | 60.25 | 58.75 | 55.37 | 53.9 |
Industry and construction | 11.24 | 11.37 | 13.11 | 16.44 | 17.35 | 19.23 | 19.98 |
Service | 15.74 | 17.49 | 21.18 | 32.21 | 23.9 | 25.40 | 26.12 |
Source: Statistical Yearbook 2004, 2007
According to statistical data, in 2004 the proportion of labor in the agricultural sector was 57.8%, with a decrease of 1.3%/year, it would take another 7 years, that is, in 2012, the agricultural labor would decrease to 50%. However, in 2007 the proportion of labor in the agricultural sector decreased to 53.9%, labor in the industrial and construction sectors increased by 19.98% in 2007 and labor in the service sector increased by 26.12% in 2007 but the increase was still low. Basically, if the structural policy has a strong incentive effect on non-agricultural sectors that use a lot of labor, it will ensure the target of reducing agricultural labor to 50% by 2010 as determined by the 9th Congress.
From 2000 to present, the social labor structure has had a positive shift in the process of economic innovation. The proportion of non-agricultural labor increased by 1.16%/year, the proportion of agricultural labor decreased by 1.16%, faster than many countries that have undergone the industrialization process.
in the world. Although it is slow and the results of the structural transformation by industry are not proportional to the transformation of the labor structure, the above process of labor structure transformation is a progressive step in the allocation of social labor resources into the orbit of economic sectoral structure transformation towards industrialization and modernization.
The economic achievements since the renovation in our country are very important, it creates new features in the relationship between sectors and the distribution of labor in economic sectors has shifted. The labor structure in economic sectors has had positive changes and progress in the direction of gradually reducing the proportion of labor in agriculture, the proportion of labor in non-agricultural sectors has gradually increased.
2.4.2. Shift in labor structure in the economy according to the United Nations' sectoral classification
In the process of economic innovation, industrialization and modernization, the labor force plays an important role and must be consistent with the shift in economic structure.
The labor force in region I is still too high, within this region, the unskilled labor force and labor in the agricultural sector account for over 50% and in general, although the labor force in region I has decreased over the years, it accounts for a small proportion, in 2007 it was 54.8% with a total of 25.8 million workers and an additional small proportion of workers in the mining industry. On the contrary, in region II, the number of workers is low because this region only counts workers in the processing industry and is 4 times less than the number of workers in region I with 5.9 million workers. Up to region III, the number of workers has increased steadily over the years due to the additional labor force in the construction industry of about 4.3%, but at a low level and higher than region I, but the increase is slow and accounts for a low proportion compared to region I, in 2007 it was 31.7%.
Table 2.20: Labor structure by United Nations sub-sector (%)
Year/Region
2000 | 2003 | 2004 | 2005 | 2006 | 2007 | |
Area I | 65.77 | 60.98 | 59.53 | 57.9 | 56.22 | 54.80 |
Region II | 9.44 | 11.24 | 11.62 | 12.34 | 13.05 | 13.50 |
Region III | 24.79 | 27.78 | 28.85 | 29.76 | 30.73 | 31.70 |
Source: Statistical Yearbook 2004, 2007
The economic achievements since the renovation in our country are very important, it creates new features in the relationship between sectors and the distribution of labor in economic sectors has shifted. The labor structure in economic sectors has had positive changes in the direction of gradually reducing the proportion of labor in sector I, the proportion of labor in the industrial sector has increased slightly but the gap between sectors is still too large. Since the end of 2007 until now, the global financial crisis has caused 405,000 people to lose their jobs; in the first months of 2009, unemployment is at risk of increasing again from 4.64% in 2008 to 5%. In 2008, the total low employment increased by 1.82% compared to 2007; the sectors with the highest correlation between labor and output products are agriculture. During this crisis, temporarily unemployed workers flocked to rural areas to find work, leading to an increase in the number of workers in sector I and a decrease in the number of workers in the remaining sectors.
Vietnam's economy has reached a turning point in the shift of labor structure by sector, the rate of decrease in the proportion of labor according to the two sectors has shown a clear difference, notably the number of laborers in the processing and service industries of the economy in the process of industrialization and modernization is lower than that of sector I. Compared with East Asian NICs in the 1950s to 1980s, the rate of increase in the proportion of labor in our country in the period 2000-2007 in the processing and service industries
much smaller and the rate of decline in the proportion of agricultural labor is low; but it is basically equivalent to the transformation of the labor structure of the NICs group. The transformation of the labor structure between regions in Vietnam's economy shows that the industrialization process is moving to a new development period in the face of challenges and difficulties (see table 2.21).
Table 2.21: Shift in labor structure
of Vietnam, Japan, Korea and Taiwan (%)
Country/Region
Year | Area I | Region II | Region III | |
Vietnam | 2000 | 65.77 | 9.44 | 24.79 |
2007 | 54.80 | 13.50 | 31.70 | |
Japan | 1951 | 45.20 | 26.60 | 28.20 |
1980 | 11.0 | 40.50 | 48.50 | |
Korea | 1950 | 57.2 | 18.0 | 24.8 |
1966 | 34.2 | 32.1 | 33.6 | |
Taiwan | 1956 | 56.0 | 20.8 | 23.2 |
1980 | 19.5 | 47.3 | 33.2 |
Source: Statistical Yearbook 2002,2007
Thus, assessing the two ways of classifying sectors, the shift in labor structure between economic sectors in our country is still unbalanced, which proves that the uneven shift in economic sector structure still accounts for a high proportion in sector I, a characteristic of a country where 80% of the population is engaged in agriculture; on the contrary, the number of workers in the industrial sector is too low and the increase in labor in the service sector is low. In reality, the slow shift in labor structure means that the shift in economic sector structure is not reasonable. In the years of innovation, high economic growth contributed to controlling and reducing inflation; between sectors, there needs to be mutual support to create common development in the economy as well as the development of each sector.
2.5. General assessment of the process of economic restructuring in our country
Since the implementation of the renovation process, great economic achievements have been achieved, the economy continues to be stable and developed, and people's lives have been significantly improved. The economic structure has shifted towards a gradual decrease in the proportion of agriculture and an increase in the proportion of industry and services. However, the speed of transition between economic sectors is still slow, specifically: