Labor status and labor rate over total population (the selected criteria used to assess population quality by ward) are different between wards, shown in table 2.5 below:
Table 2.4. Population and labor force of District 6 by ward in 2016
(Source: Processed from District 6 statistical yearbook 2016)
Ward
Population (People) | Labor force (People) | Labor rate of total population (%) | |
1 | 12,755 | 8,888 | 69.7 |
2 | 9,890 | 7,093 | 71.7 |
3 | 10,292 | 6,869 | 66.7 |
4 | 13,401 | 9,182 | 68.5 |
5 | 15,144 | 11.011 | 72.5 |
6 | 16,316 | 9,924 | 60.8 |
7 | 14,952 | 8,888 | 59.4 |
8 | 25,351 | 17,845 | 70.4 |
9 | 13,107 | 8,923 | 68.1 |
10 | 23,483 | 14,929 | 63.6 |
11 | 26,996 | 17,379 | 64.4 |
12 | 28,777 | 18,708 | 65.0 |
13 | 26,871 | 16,913 | 62.9 |
14 | 23,407 | 16,033 | 68.5 |
Maybe you are interested!
-
 Population as a Basis for Labor Demand and Economic Pressure
 -
 Summary Table of Population, Number of Households of the District
 -
 Population of Administrative Units of Vinh Cuu District (Year 2019)
 -
 Model system to assess the suitability of Vietnam's population-economic development process - 21
 -
 The World's Most Populous Continent, Young Population and Growing Purchasing Power
Table 2.4 shows that the ward with the highest rate is ward 5, the ward with the lowest rate is ward 7, this criterion of the wards is evaluated as follows:
Max - Min K = Number of levels =
72.5-59.4
5 = 2.62 (Where K is the distance between steps)
Table 2.5. Results of evaluating the ratio of labor to total population by ward
(Source: Author's calculation)
Labor rate
on total population
Level | Point | Ward | |
From 59.4 to 62.02% | Very low [1] | 1 | 6, 7 |
From 62.03% to 64.64% | Low [2] | 2 | 10, 11, 13 |
From 64.65% to 67.26% | Average [3] | 3 | 3, 12 |
67.27% to 69.88% | High [4] | 4 | 1, 4, 9, 14 |
From 69.89% to 72.5% | Very high [5] | 5 | 2,5,8 |
- Income: The survey results shown in Table 2.6 show that the average income per capita of District 6 reaches 6.17 million VND/person/month (higher than the national average and Ho Chi Minh City - Over 3 million VND/person/month and over 5 million VND/person/month). Income is differentiated by ward as follows:
Table 2.6. Results of assessment of average monthly income per capita by ward in 2018
(Source: Author processed through actual survey results)
Ward
Average income per capita (million VND/person/month) | |
1 | 7.04 |
2 | 6.81 |
3 | 5.60 |
4 | 6.19 |
5 | 6.03 |
6 | 6.47 |
Ward
Average income per capita (million VND/person/month) | |
7 | 5.44 |
8 | 5.80 |
9 | 6.60 |
10 | 6.33 |
11 | 5.78 |
12 | 6.20 |
13 | 6.51 |
14 | 5.99 |
District wide | 6.17 |
According to the survey results, the ward with the highest income is ward 1 (7.04 million), the lowest is ward 7 (5.44 million). Income is assessed as in table 2.9:
Max - Min K = Number of levels =
7.04 - 5.44
5 = 0.32
(Where K is the distance between steps)
Table 2.7. Assessment of average income per capita by ward in 2018
(Source: Author's calculation)
Per capita income
Level | Point | Ward | |
From 5.44 million to 5.76 million VND/person/month | Very low [1] | 1 | 3, 7 |
From 5.77 to 6.08 million VND/person/month | Low [2] | 2 | 5, 8, 11, 14 |
From 6.09 to 6.4 million VND/person/month | Average [3] | 3 | 4, 10, 12 |
From 6.41 to 6.72 million VND/person/month | High [4] | 4 | 6, 9, 13 |
From 6.73 to 7.04 million VND/person/month | Very high [5] | 5 | 1, 2 |
- Poverty rate: In general, the income of the population is quite high, however, the problem of the gap between rich and poor also creates many problems for society.
Table 2.8. Number of poor households in District 6 in the period 2010–2017
(Source: District 6 Statistical Yearbook 2010-2017)
Year
Number of poor households | |
2010 | 4.018 |
2011 | 913 |
2012 | 885 |
2013 | 4,147 |
2014 | 1,946 |
2015 | 575 |
2016 | 368 |
2017 | 660 |
During the period 2010-2017, the number of poor households in District 6 fluctuated a lot, mainly due to changes in the poverty classification standards in each period, but in general, the number of poor households in this period in the district tended to decrease.
The poverty situation in District 6 has improved significantly thanks to poverty reduction policies. In 2016, the Social Policy Bank Transaction Office provided loans to 369 households in the area with a loan capital of 8,528 million VND. Thanks to the lending activities of the Social Policy Bank, people have more conditions to improve their lives, creating capital for personal and household economic development.
Table 2.9 shows that the number of households and the rate of poor households differ by administrative unit in the district. The highest is Ward 5 (3.06%), the lowest is Ward 11 (0%).
Table 2.9. Poor households of District 6 in 2017 by ward
(Source: District 6 Statistical Yearbook 2017)
Ward
Total number of households | Poor household | ||
Number (households) | Ratio (%) | ||
1 | 3.206 | 24 | 0.75 |
2 | 2,500 | 12 | 0.48 |
3 | 2,579 | 10 | 0.39 |
4 | 3,339 | 43 | 1.29 |
5 | 3,788 | 116 | 3.06 |
6 | 4,805 | 31 | 0.76 |
7 | 3,740 | 43 | 1.15 |
8 | 6,350 | 188 | 2.96 |
9 | 3,299 | 13 | 0.39 |
10 | 5.910 | 72 | 1.22 |
11 | 6,768 | 0 | 0.00 |
12 | 7,218 | 73 | 1.01 |
13 | 6,624 | 18 | 0.27 |
14 | 5,856 | 17 | 0.29 |
The results of the poverty rate assessment are shown in Table 2.12:
Max - Min K = Number of levels =
3.06 - 0.00
5 ≈ 0.61
Table 2.10. Results of assessing the poverty rate by ward in 2017
(Source: Author's calculation)
Poverty rate
Level | Point | Ward | |
From 0.00% to 0.61% | Very low [1] | 5 | 2, 3, 9, 11, 13, 14 |
From 0.62% to 1.22% | Low [2] | 4 | 1, 6, 7, 10, 12 |
From 1.23% to 1.83% | Average [3] | 3 | 4 |
From 1.84% to 2.44% | High [4] | 2 | / |
From 2.45% to 3.06% | Very high [5] | 1 | 5, 8 |
2.3.2. Food and nutrition
District 6 always focuses on ensuring food security in the area. The development of many commercial stores specializing in food, planning concentrated markets under the management of authorities at all levels as well as effectively maintaining price-stabilized food stores helps to meet the food consumption needs of the people, thereby significantly improving the food and nutrition regime.
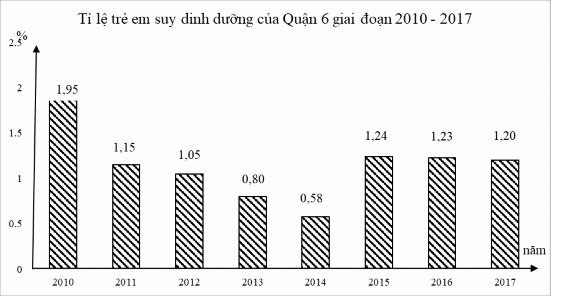
Figure 2.3. Rate of malnourished children in District 6, 2010–2017
(Source: District 6 Statistical Yearbook 2010–2017)
During the period 2010–2017, the rate of malnourished children under 5 years old in District 6 fluctuated at 0.58–1.95% (highest in 2010 and lowest in 2014). In 2017, the rate of malnourished children under 5 years old was 1.2%, lower than the city average of 1.8% and the national average of 6.2%. This shows that the process of nutritional health care for children under 5 years old in District 6 has produced positive figures. However, in terms of the change in the rate of malnourished children, the period 2014–2017 witnessed an increase in this rate. This is not a positive sign in health care and raises many issues requiring the improvement of health care quality, ensuring the learning, education and capacity development of children.
It can be seen that the food and nutrition issues of District 6 have very specific characteristics of a locality that does not produce much agriculture. However, thanks to maintaining production, planning, and good orientation, the food security situation in the district has had good results, people have access to many types of delicious, clean food, no cases of mass food poisoning have been recorded during this period, ... However, meeting the nutritional needs of the entire population is still limited, leading to the existence of more than 1% of children under 5 years old being malnourished, this is an issue that needs attention and focus to change for the comprehensive physical development of children in particular and the residents of the District in general.
2.3.3. Education
Education is considered a leading foundation in developing and improving the economic life and quality of life of the people. Education is a criterion reflecting the quality of life of the population.
The educational status of the District is shown through the criteria shown in Table 2.13:
- Adult literacy rate: this index of District 6 was about 98.9% in 2017, equivalent to the level of Ho Chi Minh City, higher than the average of Ho Chi Minh City and the whole country (98.5% and 95.1%).
- The budget expenditure for education in 2016 of District 6 was 259,168 billion VND, accounting for 30.17% of the total budget expenditure of the entire District. When compared to Ho Chi Minh City, it is easy to see that the budget expenditure for education of District 6 is high (Ho Chi Minh City in 2016 spent 9.68% of the budget on education).
Table 2.11. Some general education indicators of District 6 in the period 2010–2017
(Source: District 6 Statistical Yearbook 2010–2017)
Year
Target
2010 | 2011 | 2012 | 2013 | 2014 | 2015 | 2016 | 2017 | |
Number of schools | 37 | 40 | 40 | 40 | 40 | 40 | 38 | 38 |
Number of classes | 1,024 | 1,082 | 1,062 | 1,084 | 1.107 | 1.113 | 1,092 | 1,098 |
Number of teachers pill | 1,521 | 1,642 | 1,697 | 1,750 | 1,768 | 1,921 | 1,882 | 1,914 |
Arithmetic born | 40,646 | 41,966 | 41,597 | 42,690 | 42,903 | 42,910 | 43,260 | 43,796 |
Number of students High School | 7,418 | 7,934 | 7,853 | 7,924 | 7,947 | 7.701 | 8,239 | 9,471 |
Number of students 1 layer bottle | 39.69 | 38.79 | 39.17 | 39.38 | 38.76 | 38.55 | 39.62 | 39.89 |
Average number of students 1 teacher | 26.72 | 25.56 | 24.51 | 24.39 | 24.27 | 22.34 | 22.99 | 22.88 |
Ratio of high school students to total students born (%) | 18.3 | 18.9 | 18.9 | 18.6 | 18.5 | 17.9 | 19.0 | 21.6 |