Table 4.3 Weight growth of red tilapia
Solution
Wđ (g) | Wc (g) | WG (g) | DWG (g/day) | SGR (%/day) | |
1: 25N | 0.02 ± 0.00 | 1.31 ± 0.03a | 1.29 ± 0.02a | 0.03 ± 0.00a | 9.89 ± 0.05a |
2: 30N | 0.02 ± 0.00 | 1.43 ± 0.03b | 1.42 ± 0.03b | 0.03 ± 0.00b | 10.1 ± 0.04 b |
3: 35N | 0.02 ± 0.00 | 2.36 ± 0.05 c | 2.35 ± 0.04 c | 0.05 ± 0.00 c | 11.4 ± 0.04 c |
Maybe you are interested!
-
 Graph Showing the Relationship Between Tear Size and Number of Microlesions Used
 -
 Graph Showing the Enrichment Factor Ef by Depth of 26 Elements in Core 160408-2.
 -
 Dpcsv Curve And Standard Addition Graph For Determination Of Selenium Form In Aqueous Phase After Defatting With 5ml N-Hexane (1 Time)
 -
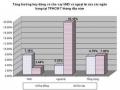 Chart Showing Growth in Deposits and Lending of Commercial Banks in Ho Chi Minh City in the First 7 Months of the Year.
 -
 Showing Humanity to the Sad and Lonely Ghosts
Values shown are mean and standard deviation. Values in the same column with different letters are significantly different (p < 0.05)
Table 4.3 shows that the growth rate of fish in three treatments but fed with different protein content has a difference between the values. Specifically, in treatment 1, fish have the lowest absolute growth rate per day of only 0.03 g/day, the highest is in treatment 3 reaching 0.05 g/day. Through statistical analysis, it can be seen that the growth rate of fish between treatments has a significant difference p < 0.05.
In experiment 1, because the food supply did not meet the protein needs, the fish grew slowly, thereby not having enough nutrients for the fish to grow and develop, leading to a growth rate in weight of only 0.03 g/day. In experiment 3, it was found that in experiment 3, the fish grew 2.35 g, which is consistent with the study of Duong Nhut Long (2003), when raising red tilapia from fry to fish, the fish can reach a weight of 2-3 g/fish.
Within the protein requirement range of tilapia (25-35N), the growth in weight of fish will increase as the protein content in the feed increases. Specifically, in the experiment of feeding fish with 35N feed, fish will grow better than the 30N and 25N treatments.
4.1.2.3 Length growth of red tilapia
Length growth of red tilapia after 45 days of rearing is presented in Table 4.4.
Table 4.4 Length growth of red tilapia
NT
Lđ (cm) | Lc (cm) | LG (cm) | DLG (cm/day) | |
1 | 0.85 ± 0.00 | 4.15 ± 0.09a | 3.30 ± 0.09a | 0.07 ± 0.00a |
2 | 0.85 ± 0.00 | 4.29 ± 0.05a | 3.44 ± 0.05a | 0.08 ± 0.00a |
3 | 0.85 ± 0.00 | 5.01 ± 0.12b | 4.16 ± 0.12b | 0.09 ± 0.00b |
Values shown are mean and standard deviation. Values in the same column with different letters are significantly different (p < 0.05)
Table 4.4 shows that the increase in fish length in experiment 3 compared to the fish length in the other two experiments is statistically significant ( p < 0.05 ). In which, the increase in fish length in experiment 1 is the lowest, reaching only 3.30 cm/individual and the highest is the increase in fish length in experiment 3 reaching 4.16 cm/individual. This proves that when raising fish with high protein content, fish will have a faster increase in length than the corresponding values of fish raised with low protein content, under the same experimental conditions.
Le Minh Tuan (2010) tested the rearing of red tilapia from fry to fingerling stage. After 1 month of rearing, the best growth in length of fish was 4.19 ± 0.07 cm. This result was also equivalent to the result of the experiment of feeding fish with 35N feed with an increase in length of 4.16 ± 0.117 cm.
The above results have confirmed that the protein content in the feed greatly affects the growth in both weight and length of the fish. Within the appropriate protein range of the species, when reared with 35N feed, the fish will grow faster in length and weight than with 30N and 25N feed.
According to Pham Minh Thanh and Nguyen Van Kiem (2009), if the feed has an inappropriate protein content, the fish will not achieve the desired growth rate (especially in the stage from fry to fingerling), or in other words, the seed production will not be effective. When the feed provided to the fish meets the nutritional needs, the fish will increase rapidly in weight and obviously the length will also increase accordingly.
4.1.2.4 Fish mass differentiation ratio
Growth is the increase in size and mass of fish over time, as a result of metabolism. The nature of fish growth is uneven, the growth process of fish is greatly influenced by physiological factors (internal factors) and ecological factors (external factors). Among the external factors, food is a very important factor that determines the growth differentiation of fish species.
The growth differentiation of fish in red tilapia rearing experiment with different protein content is shown in Figure 4.1.
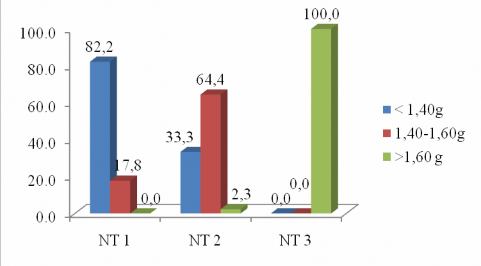
Figure 4.1 Chart showing the differentiation of fish weight growth in experiment 1
Figure 4.1 shows that the protein content in the feed affects the differentiation according to the mass of red tilapia from fry to flavor stage. The fish size in the experiment was divided into 3 mass groups. The group of fish with the smallest mass was under 1.40g; the average
The average weight of fish was from 1.40-1.60g and the group of fish was larger than 1.60g. In experiment 1 and experiment 2, the number of individuals with small weight accounted for a larger proportion than in experiment 3.
In experiment 3, the fish mass over 1.60 g accounted for 100%, while in experiment 2 it was only 2.3% and in experiment 1 there was no appearance of any individual with this mass group. On the contrary, when analyzing the fish mass less than 1.40 g; in experiment 3 there was no individual and in experiment 2 it only accounted for about 33.3%, most of which fell into experiment 1 at 82.2%. According to Tran Thi Thanh Hien and Nguyen Anh Tuan (2009), the protein requirement of red tilapia in the stage of fry development is from 30-35N, so with experiment 1 feeding fish 25N is not suitable.
According to Pham Minh Thanh and Nguyen Van Kiem (2009), the protein requirement in fish food varies according to the nutritional characteristics of the fish. In the same development stage, if the food does not meet the nutritional needs of the fish, the fish will grow slowly and growth differentiation will occur. Comparing 3 experiments shows that the suitable food for optimal growth of fish is 35N.
4.1.2.5 Feed conversion ratio (FCR) of red tilapia
Feed conversion ratio (FCR) is a very important index that determines the economic efficiency of fish farming. Low FCR reduces feed costs but fish still achieve fast growth rates. On the contrary, high FCR results in high feed costs, leading to low profits (Tran Thi Thanh Hien and Nguyen Anh Tuan, 2009).
Table 4.5 Feed consumption coefficient of red tilapia
Formula (NT)
FCR | |
NT 1: Feed fish food containing 25N | 1.56 ± 0.05b |
NT 2: Feed fish food containing 30N | 1.50 ± 0.02b |
NT 3: Feed fish food containing 35N | 1.32 ± 0.04a |
Values shown are mean and standard deviation.
Values in the same column with the same letter are not significantly different (p > 0.05)
Table 4.5 shows that the highest FCR coefficient in the experiment using fish feed with the lowest protein content of 25% was 1.56. But when feeding fish with 35N feed, the lowest FCR coefficient was 1.32. According to Vo Thi To Nhu (2011), when feeding fish with feed with 42% protein content, the FCR coefficient was 1.2. This shows that at a protein content of 35% with an FCR coefficient of 1.32 is suitable in the experiment, but it is possible that with a higher protein content, the FCR coefficient will be lower. Through statistical analysis of the FCR coefficient, it was found that there was a significant difference between treatment 3 and the other two treatments ( p < 0.05 ).
According to Pham Minh Thanh and Nguyen Van Kiem (2009), the key and most important principle in fish rearing is that the feed must be suitable for the nutritional characteristics of the fish, which also shows the effectiveness of the feed used. Thus, feed containing 35N will be suitable for rearing red tilapia from fry to flavor stage.
4.2 Effects of feed rations on growth and survival rate of red tilapia from fry to fingerling stage
4.2.1 Experimental environmental indicators
For aquatic organisms, the water environment is an important factor, greatly affecting their life activities. Environmental factors have a direct or indirect impact on the body of aquatic organisms, changing their physiological and biochemical activities. Therefore, environmental indicators were monitored throughout the experiment, the results of some hydro-physical and chemical indicators are recorded in Table 4.6.
Table 4.6 Environmental factors in the experiment
Element
Session | NT 1 | NT 2 | NT 3 | |
Temperature | Bright | 24.7 ± 0.05 | 24.7 ± 0.03 | 24.7 ± 0.03 |
Afternoon | 27.8 ± 0.11 | 27.8 ± 0.03 | 27.8 ± 0.04 | |
pH | Bright | 7.46 ± 0.22 | 7.73 ± 0.02 | 7.75 ± 0.04 |
Afternoon | 7.73 ± 0.04 | 7.83 ± 0.08 | 7.84 ± 0.08 |
Values shown are mean and standard deviation.
Temperature:
Table 4.6 shows that the water temperature between the treatments has a difference but not significant, the reason is that the rearing tanks have the same material, which is Styrofoam boxes, so the temperature changes little. On the other hand, the experiment was conducted on the same volume of water, and was continuously aerated. The average temperature in the treatments fluctuated from 24.7 0 C in the morning to 27.8 0 C in the afternoon. This result is consistent with the assessment of Pham Minh Thanh and Nguyen Van Kiem (2009), the suitable temperature for red tilapia is from 20-31 0 C.
pH fluctuation:
According to Nguyen Van Kiem and Pham Minh Thanh (2013), the ability of young fish to adapt to pH is very limited, fish will die when the environment has low pH (pH < 5) and high pH (pH > 9). On the other hand, according to Le Van Cat et al., (2006), the favorable pH for fish development is from 6.5-9. In this experiment, pH fluctuated between treatments but very low, the measured pH ranged from 7.46 to 7.84. Therefore, this pH value is within the appropriate range for red tilapia.
4.2.2 Effects of diet on growth and survival rate of red tilapia
4.2.2.1 Survival rate of red tilapia
Survival rate is one of the important indicators to evaluate the effectiveness of the rearing process, the success or failure of a production process. The fluctuation in survival rate of red tilapia after 45 days of rearing is shown in Table 4.7.
Table 4.7 Survival rate of red tilapia
Formula (NT)
Survival rate (%) | |
NT 1: food ration 10% body weight | 92.2 ± 1.91a |
NT 2: Food ration 15% body weight | 93.3 ± 0.00 a |
NT 3: Food ration 20% body weight | 90.0 ± 3.30a |
Values shown are mean and standard deviation.
Values in the same column with the same letter are not significantly different (P > 0.05)
After 45 days of experiment, fish fed with a ration of 15% of body weight achieved the highest survival rate of 93.3%, followed by fish fed with a ration of 10% of body weight at 92.2%, and finally fish fed with a ration of 20% of body weight only achieved 90.0%.
Through statistical analysis of the survival rate of fish, it was found that there was a difference between the three treatments but the difference was not significant ( p > 0.05 ). This is explained by the fact that at the stage from hatching to fingerling, the fish were healthy and actively caught prey, so the food with this ration did not affect the survival rate much under the same good care and management conditions, and the same food quality.
4.2.2.2 Weight growth of red tilapia
The growth in fish weight is an important indicator used to evaluate the quality of fish fry and it also determines the economic efficiency of the producer. In fish farming, the amount of food provided to fish plays an important role in the growth of fish.
Table 4.8 Weight growth of red tilapia in TN2
NT
Wđ Wc (g) (g) | WG (g) | DWG (g/day) | SGR (%/day) | ||
NT1 | 2.33 ± 0.07 | 12.4 ± 0.06 b | 10.1 ± 0.10 b | 0.23 ± 0.00b | 3.72 ± 0.02b |
NT2 | 2.33 ± 0.07 | 15.9 ± 0.06 c | 13.5 ± 0.09 c | 0.30 ± 0.00 c | 4.26 ± 0.01 c |
NT3 | 2.33 ± 0.07 | 12.1 ± 0.21a | 9.70 ± 0.19a | 0.22 ± 0.00a | 3.65 ± 0.04a |
Values shown are mean and standard deviation.
Values in the same column with the same letter are not significantly different (P > 0.05)
From Table 4.8, it can be seen that the growth rate of fish weight has a difference between the treatments. Specifically, the growth of fish is highest in NT2 with a value of 13.5g; next is treatment 1 with 10.1g; lowest is treatment 3 with only 9.70g. Through statistical analysis, these values are significantly different ( p < 0.05 ).
In experiment 1 and experiment 2, the fish had a growth value in weight of 10.1g and 13.5g respectively. According to Duong Nhut Long (2003), during the period of raising fish from fingerling to fingerling, fish can reach 10-12g/fish after about 2 months of age. Thus, the results recorded in the experiment are completely consistent.
According to Tran Thi Thanh Hien and Nguyen Anh Tuan (2009), fish will grow slowly or stop when the amount of food provided is insufficient for a long time. On the contrary, if there is excess food, the efficiency of food conversion will be poor. Experimental results show that when raising fish with a ration of 10% of body weight, the food does not meet the nutritional needs of the fish. However, when the protein content increases beyond the need of up to 20% compared to body weight, the fish will be passive in catching prey, which makes the digestion low, leading to the growth rate of the fish slowing down.
4.2.2.3 Length growth of red tilapia
Length growth is one of the important indicators used to evaluate fish development and it also contributes to determining the economic efficiency of producers in the stage of raising fish from seed to fingerling.
Table 4.9 Length growth of red tilapia
NT
Length (cm) | Lc (cm) | LG (cm) | DLG (cm/day) | |
NT1 | 5.08 ± 0.210 | 9.04 ± 0.13 b | 3.96 ± 0.13b | 0.09 ± 0.00b |
NT2 | 5.08 ± 0.210 | 9.62 ± 0.10 c | 4.54 ± 0.10 c | 0.10 ± 0.00 c |
NT3 | 5.08 ± 0.210 | 8.55 ± 0.17a | 3.47 ± 0.17a | 0.08 ± 0.00a |
Values shown are mean and standard deviation.
Values in the same column with the same letter are not significantly different (p > 0.05)
Table 4.9 shows that the fish in treatment 2 had the highest average length of 9.62 cm; next was treatment 1 at 9.04 cm and the lowest was treatment 3, only reaching 8.55 cm.
The results show that the feed ration greatly affects the growth of fish in both weight and length. When raising red tilapia with 35N feed, the feed ration provided is 15%, the fish will grow better than the ration of 10% and 20% compared to the body weight.
According to Tran Thi Thanh Hien and Nguyen Anh Tuan (2009), the feeding level affects the energy expenditure of aquatic animals. Feeding levels that are too low or too high will negatively affect the growth of fish. In experiment 1, fish were fed with a ration of 10% of their body weight, because the food provided was insufficient to meet the energy needs for fish growth, leading to individuals that did not catch food for a long time to grow slowly.
When increasing the fish's food ration within the allowable limit, the fish will store more energy (Tran Thi Thanh Hien and Nguyen Anh Tuan, 2009). In experiment 2, feeding the fish with a ration equal to 15% of their body weight, the food has met the fish's energy needs, meaning that the fish's growth will increase. However, when the amount of food provided is 20% of their body weight, the fish will be passive in catching prey, which also has a negative impact on the fish's development.
4.2.2.4 Growth differentiation ratio according to weight of red tilapia
The level of differentiation in fish growth and weight in the experiment of raising red tilapia with different diets from fry to fingerling stage is presented in Figure 4.3.
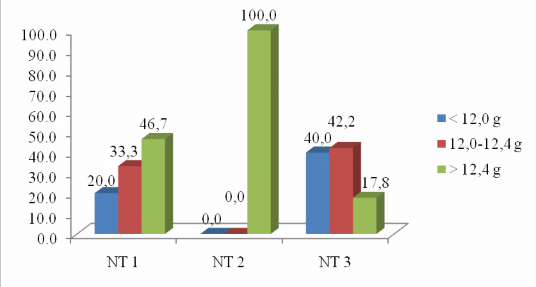
Figure 4.3 Chart showing the level of differentiation by mass of fish in TN2
After the end of the experiment, the fish differentiation rate was divided into 3 mass groups as follows: small fish group with mass less than 12.0g; medium fish group from 12.0-12.4g and large fish group over 12.4g.
When analyzing the group of large fish over 12.4g, in experiment 2 it accounted for 100%; experiment 1 accounted for 46.7%, while experiment 3 only reached 17.8%. On the contrary, when analyzing the group of small fish, it was found that in experiment 2 there were no individuals under 12.0g, but the majority fell into experiment 3 accounting for 40.0% and experiment 1 only accounted for 20%. This is explained by the fact that with experiments 1 and 3, the food ration provided for the fish was not suitable compared to the assessment of Melard and Philipart (1981), the appropriate food ration for red tilapia from the stage of fry to fingerling (5-20g) is about 15% of the body weight.
4.2.2.5 Feed conversion ratio (FCR)
Feed consumption coefficient of red tilapia from fry to fingerling stage is presented in table 4.10.
Table 4.10 Feed consumption coefficient of red tilapia
Formula (NT)
FCR | |
NT1: Ration 10% body weight/day | 1.48 ± 0.010 b |
NT2: Ration 15% body weight/day | 1.33 ± 0.010a |
NT3: Ration 20% body weight/day | 1.61 ± 0.010 c |
Values shown are mean and standard deviation.
Values in the same column with the same letter are not significantly different (p>0.05)
Table 4.10 shows that the FCR coefficient of fish in different treatments is statistically significant at p < 0.05 . The treatment using food with a ration of 20% of body weight resulted in the highest FCR coefficient of 1.61 because the food provided was too much compared to the needs of the fish. However, in treatment 1, the amount of food provided was equal to 10% of body weight, which did not meet the needs of the fish, leading to an FCR coefficient of 1.48. According to Tran Thi Thanh Hien and Nguyen Anh Tuan (2009), feeding fish with a limited ration (calculated by body weight) will lead to a high food conversion ratio and vice versa.
Thus, in the experiment of feeding fish a diet of 15% body weight with 35N food, the lowest FCR coefficient was 1.33.