I geo index by depth in core 160408-1
3
5-10
Maybe you are interested!
-
 Graph Showing the Relationship Between Tear Size and Number of Microlesions Used
 -
 Graph Showing Differentiation of Fish Weight Growth in Experiment 1
 -
 “Cronbach's Alpha Cost Factor Scale”
 -
 Dpcsv Curve And Standard Addition Graph For Determination Of Selenium Form In Aqueous Phase After Defatting With 5ml N-Hexane (1 Time)
 -
 Perform Factor Analysis (Efa) for Independent Variables
15-20
2
25-30
30-35
1
45-50
60-65
67-72
0
Al Ti V Mn Dy Na K As La Sm Lu Sc Cr Fe Co Rb Sb Cs Ce Nd Eu Tb Yb Hf Ta Th
80-85
90-95
-1
115-120
135-140
-2
160-165
175-180
195-200
-3
Geological Sedimentation Index I geo
The average levels of the elements Na, K, As, Sm, Cs, Nd and Hf (2 < EF < 5) were mainly in the surface samples, while most of the remaining elements had an EF < 2 and were low or minimally enriched. For elements with an average enrichment factor, it indicates that in addition to the natural contribution, there may be contributions from other sources. The contribution to As can be explained in relation to waste from the processing industry, chemicals, and pesticides used in the area. In addition, As, Cs, Nd, Hf, and Sm are also produced during the weathering of rocks and ores, dissolved in water and then deposited in sediments. The main source of contribution to Potassium may be due to Potassium existing in fertilizers from agricultural production activities in the area at the time of sedimentation.
Figure 3.9. Graph showing the geological deposition index I geo versus depth of 26 elements in core 160408-1.
The geological sedimentation index I geo core 160804-1 is shown in Figure 3.9. The calculation results show that most of the elements have a geological sedimentation index at the level of I geo < 0. Besides, there are 8 elements including Na, K, As, Sm, Cs, Nd, Eu and Hf at the level of contamination from uncontaminated to moderately contaminated (0 < I geo < 1). In particular, the element As in the sample at a depth of 67-72cm has an index of I geo > 1 at a moderately contaminated level .
Depth enrichment factor in core 160408-2
3
5-10
15-20
25-30
60-65
2
85-90
45-50
35-40
1
100-105
120-125
50-55
75-80
0
Al Ti V Mn Dy Na K As La Sm Lu Sc Cr Fe Co Rb Sb Cs Ce Nd Eu Tb Yb Hf Ta Th
Enrichment Factor(EF)
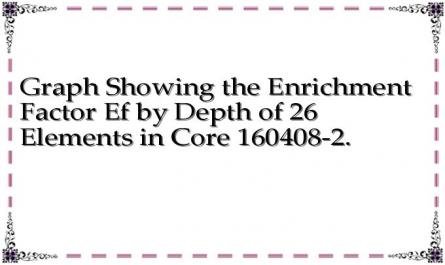
c) Core 160408-2:
Figure 3.6. Graph showing the enrichment factor EF versus depth for 26 elements in core 160408-2.
From the calculation results of the EF coefficients of 26 elements in 11 samples at different depths in core 160408-2 in figure 3.6 taken from a location 8.5km from the coast of Dong Hai district, Bac Lieu province. It shows that most of the elements have coefficients
I geo index by depth in core 160408-2
2
5-10
15-20
1
25-30
60-65
85-90
0
45-50
Al Ti V Mn Dy Na K As La Sm Lu Sc Cr Fe Co Rb Sb Cs Ce Nd Eu Tb Yb Hf Ta Th
35-40
100-105
-1
120-125
50-55
75-80
-2
Igeo geological deposition index
EF enrichment < 2 means no enrichment or minimal enrichment. In addition, the EF enrichment factor also shows that there are 4 elements in some depth samples with an EF enrichment factor of about 2 < EF < 5 including Cs, Nd, Yb and Hf at an average enrichment level. The main source of these elements besides natural sources such as minerals existing in natural sediments such as monazite, lepidolite, polluxite, allanite or zirconium, etc. and some enriched elements may be due to contributions from human impacts.
Figure 3.7. Graph showing the geological deposition index I geo versus depth of 26 elements in core 160408-2.
In addition to the enrichment factor EF, the geological deposition index in Figure 3.7 also indicates that most of the 26 elements analyzed in core 160408-2 have I geo index < 0 and are at uncontaminated levels. A few elements have contamination levels ranging from
uncontaminated to moderately contaminated in some depth samples such as Na, As, Ti, Rb, Th, Tb, Ce, Nd, Yb, Cs, Eu, Ti, and Sb (0 < I geo < 1). The I geo index also shows that the marine sedimentary environment at a location 8.5 km from the coast of Dong Hai district, Bac Lieu province has slight contamination with some of the above elements.
Depth enrichment factor in core 170408-3
8
5-10
7
20-25
25-30
6
40-45
5
60-65
4
80-85
95-100
3
115-120
2
170-175
1
140-145
145-150
0
Al Ti V Mn Dy Na K As La Sm Lu Sc Cr Fe Co Rb Sb Cs Ce Nd Eu Tb Yb Hf Ta Th
Enrichment Factor (EF)
d) Core 170408-3:
Figure 3.2. Graph showing the enrichment factor EF versus depth for 26 elements in 170408-3.
The results of the enrichment factor (EF) analysis in Figure 3.2 of 26 elements in 11 samples from core 170408-3 taken from a location 13.5km off the coast of Dong Hai district, Bac Lieu province indicate that the elements including Al, Ti, V, Mn, Na, K, As, La, Sm, Lu, Sc, Cr, Fe, Co, Rb, Sb, Tb, Ta in most depth samples have an enrichment factor EF ≤ 2, meaning that these elements have an enrichment level from no enrichment or are enriched at a minimum level. Some elements in some depth samples are shown to have
I geo index by depth in core 170408-3
3
5-10
20-25
2
25-30
40-45
1
60-65
80-85
0
Al Ti V Mn Dy Na K As La Sm Lu Sc Cr Fe Co Rb Sb Cs Ce Nd Eu Tb Yb Hf Ta Th95-100
-1
115-120
170-175
-2
140-145
145-150
-3
Geological Sedimentation Index (Igeo)
moderate enrichment (2 < EF < 5) such as Cs (40-150cm), Th (5-10cm) and Hf (25-150cm) and some elements in the rare earth group including (Dy, Ce, Nd, Eu, Yb) at some depths. Especially the element Hafnium (Hf) in two samples of the sediment surface area (5-10, 20-25cm) had a factor of 5 < EF < 20 at a significant enrichment level.
Figure 3.3. Graph showing the geological deposition index I geo versus depth of 26 elements in core 170408-3.
The results of the analysis of the geological sedimentation index from Figure 3.3 also show that most of the elements have relatively good I geo indexes and are at I geo < 0, meaning they are not contaminated. Except for some elements such as Ti, Hf, Cs and some elements in the rare earth group (including Ce, Nd, Eu, Dy, Yb) with 0 < I geo < 1 at some depths in the range of 40-120cm, they are not contaminated to moderately contaminated. In particular, the I geo index for Hf in the surface sediment area has 1 < I geo < 2 at a moderately contaminated level.
Through the analysis of the enrichment coefficient EF and the geological deposition index I geo in 4 cores of marine sediment samples taken in the coastal waters of Dong Hai district, Bac Lieu province, it can be initially confirmed that the marine environment here has been polluted for the majority of 26 analyzed elements and the level of contamination mainly occurs in the nearshore area. In which, the level of pollution occurs relatively high in some depth samples of rare earth elements (Dy, Ce, Nd, Sm, Lu, Yb, Eu, Tb, etc.) and some trace metals such as Hf, Cs, Th, Ta, etc. The main cause may be due to the existence of minerals in the sediment samples originating from soil and rocks due to coastal erosion activities. The remaining elements such as As, K, in addition to natural sources, may be due to fertilizers, pesticides and animal feed used in agricultural production and aquaculture in the coastal areas of Dong Hai district. In addition, with a dense system of canals, economic and transportation activities in Dong Hai district, Bac Lieu province are mainly carried out by river and sea, which also plays a major role in the transportation process and contributes to increasing pollution of elements in coastal sediment samples. In particular, the GH01 core has a higher level of contamination than the remaining sediment sample cores, possibly due to the location of the GH01 core near the mouth of the Ganh Hao river in Long Dien Tay commune, Dong Hai district (about 120m from the shore), which is where serious landslides often occur. The situation of landslides in the river mouth and coastal areas here is quite complicated. The coastal area of the Ganh Hao river has begun to erode since 1886. The average erosion rate over 100 years (1886-1995) is 100 ha/year. The main cause may be due to the unreasonable infrastructure of housing, markets, public works built on the shore, along the shore, lacking planning, encroachment on the river affecting the flow structure; boats anchoring in the coastal area without control has caused instability of the Ganh Hao riverbank. In addition, the water of the Ganh Hao river is heavily polluted, possibly due to untreated wastewater from seafood processing companies in Ca Mau city being discharged directly into the Ganh Hao river, waste from agricultural activities, along with household waste of people and waste from floating markets in the area.
3.3.2. Coastal marine sediments in U Minh district, Ca Mau province
Depth enrichment factor in core 070408-1
3
25-30
55-60
75-80
97-102
2
122-127
152-157
5-10
15-20
1
35-40
45-50
65-70
177-182
195-200
0
Al Ti V Mn Dy Na K As La Sm Lu Sc Cr Fe Co Rb Sb Cs Ce Nd Eu Tb Yb Hf Ta Th
Enrichment Factor (EF)
Core 070408-1:
Figure 3.10. Graph showing the enrichment factor EF versus depth for 26 elements in core 070408-1.
The results of calculating the enrichment factor EF in core 070408-1 taken from the area located 5.7km from the coast of U Minh district, Ca Mau province shown in Figure 3.10 show that most of the 26 analyzed elements have EF coefficients in the range of 0 < EF < 2 and belong to the level of enrichment at a low level or minimal enrichment in all 13 samples taken from 13 depths. Except for two elements Cs (except for samples at depths of 35-40, 122-127cm) and Nd (except for samples at depths of 55-60cm, 65-70cm) with EF coefficients in the range of (2 < EF < 5) at the average enrichment level. Through the analysis of the enrichment factor EF, it can be seen that the sea area of U Minh district, Ca Mau province 5.7km away has not been significantly affected by human impacts on the marine environment or is at a minimal level of impact.
I geo index by depth in core 070408-1
2
25-30
55-60
1
75-80
97-102
122-127
0
Al Ti V Mn Dy Na K As La Sm Lu Sc Cr Fe Co Rb Sb Cs Ce Nd Eu Tb Yb Hf Ta Th
152-157
5-10
-1
15-20
35-40
45-50
-2
65-70
177-182
195-200
-3
Geological Sedimentation Index I geo
Figure 3.11. Graph showing the geological deposition index I geo versus depth of 26 elements in core 070408-1.
The geological sedimentation index in core 070408-1 shown in Figure 3.11 indicates that most of the elements are at the uncontaminated level (I geo < 0). Some elements such as Na, Cs, Nd, Yb at some depths have I geo index in the range (0 < I geo < 1) belonging to the uncontaminated to moderately contaminated level. The Cs, Nd and Yb content may be due to the contribution of minerals such as lepidolite, polluxite, monazite, etc. existing in natural marine sediments. Therefore, the geological sedimentation index shows the level of contamination of the marine environment through the sediments of the area located 5.7km from the coast of U Minh district, Ca Mau province at the level of contamination that is not of concern to the environment at least for the 26 elements analyzed.