PL-2.6: Model results analyzing the impact of trade liberalization.
Variable tax rate (0%) | Government Losses (USD) | Domestic producer losses (USD) | Economic efficiency for society (USD) | Consumer surplus (USD) | Reduced employment (workers) | |
1. Plastic ingredient | 3 | 24,640,080 | 12,165,847 | 35,411 | 36,841,338 | 169 |
2. Grease flora and fauna | 4 | 8,656,917 | 3,902,164 | 2,253 | 12,561,334 | 663 |
3. Paper of all kinds | 10 | 20,235,292 | 16,855,166 | 155,351 | 37,245,810 | 2,274 |
4. Chemicals type | 2 | 10,527,664 | 4,727,064 | 11,665 | 15,266,393 | 688 |
5. Car | 40 | 94,053,558 | 71,666,304 | 582,134 | 166,301,996 | 1,360 |
6. Fiber | 3 | 8,785,010 | 5,854,690 | 24,013 | 14,663,714 | 1,115 |
7. Steel | 4 | 62,041,833 | 41,239,150 | 54,029 | 103.335.011 | 1,004 |
8.Pesticides & fuel | 3 | 4,549,471 | 2,771,830 | 35,553 | 7,356,827 | 227 |
9. Accessories cigarette | 5 | 12,830,865 | 8,862,553 | 188,431 | 21,881,849 | 923 |
Total | 246,320,690 | 168,044,741 | 1,088,840 | 415,454,272 | 8,423 |
Maybe you are interested!
-

 Solutions for tourism development in Tien Lang - 10
zt2i3t4l5ee
zt2a3gstourism, tourism development
zt2a3ge
zc2o3n4t5e6n7ts
- District People's Committees and authorities of communes with tourist attractions should support, promote, and provide necessary information to people, helping them improve their knowledge about tourism. Raise tourism awareness for local people.
*
* *
Due to limited knowledge and research time, the thesis inevitably has shortcomings. Therefore, I look forward to receiving guidance from teachers, experts as well as your comments to make the thesis more complete.
Chapter III Conclusion
Through the issues presented in Chapter II, we can come to some conclusions:
Based on the strengths of available tourism resources, the types of tourism in Tien Lang that need to be promoted in the coming time are sightseeing and resort tourism, discovery tourism, weekend tourism. To improve the quality and diversify tourism products, Tien Lang district needs to combine with local cultural tourism resources, at the same time combine with surrounding areas, build rich tourism products. The strengths of Tien Lang tourism are eco-tourism and cultural tourism, so developing Tien Lang tourism must always go hand in hand with restoring and preserving types of cultural tourism resources. Some necessary measures to support and improve the efficiency of exploiting tourism resources in Tien Lang are: strengthening the construction of technical facilities and labor force serving tourism, actively promoting and advertising tourism, and expanding forms of capital mobilization for tourism development.
CONCLUDE
I Conclusion
1. Based on the results achieved within the framework of the thesis's needs, some basic conclusions can be drawn as follows:
Tien Lang is a locality with great potential for tourism development. The relatively abundant cultural tourism resources and ecological tourism resources have great appeal to tourists. Based on this potential, Tien Lang can build a unique tourism industry that is competitive enough with other localities within Hai Phong city and neighboring areas.
In recent years, the exploitation of the advantages of resources to develop tourism and build tourist routes in Tien Lang has not been commensurate with the available potential. In terms of quantity, many resource objects have not been brought into the purpose of tourism development. In terms of time, the regular service time has not been extended to attract more visitors. Infrastructure and technical facilities are still weak. The labor force is still thin and weak in terms of expertise. Tourism programs and routes have not been organized properly, the exploitation content is still monotonous, so it has not attracted many visitors. Although resources have not been mobilized much for tourism development, they are facing the risk of destruction and degradation.
2. Based on the results of investigation, analysis, synthesis, evaluation and selective absorption of research results of related topics, the thesis has proposed a number of necessary solutions to improve the efficiency of exploiting tourism resources in Tien Lang such as: promoting the restoration and conservation of tourism resources, focusing on investment and key exploitation of ecotourism resources, strengthening the construction of infrastructure and tourism workforce. Expanding forms of capital mobilization. In addition, the thesis has built a number of tourist routes of Hai Phong in which Tien Lang tourism resources play an important role.
Exploiting Tien Lang tourism resources for tourism development is currently facing many difficulties. The above measures, if applied synchronously, will likely bring new prospects for the local tourism industry, contributing to making Tien Lang tourism an important economic sector in the district's economic structure.
REFERENCES
1. Nhuan Ha, Trinh Minh Hien, Tran Phuong, Hai Phong - Historical and cultural relics, Hai Phong Publishing House, 1993
2. Hai Phong City History Council, Hai Phong Gazetteer, Hai Phong Publishing House, 1990.
3. Hai Phong City History Council, History of Tien Lang District Party Committee, Hai Phong Publishing House, 1990.
4. Hai Phong City History Council, University of Social Sciences and Humanities, VNU, Hai Phong Place Names Encyclopedia, Hai Phong Publishing House. 2001.
5. Law on Cultural Heritage and documents guiding its implementation, National Political Publishing House, Hanoi, 2003.
6. Tran Duc Thanh, Lecture on Tourism Geography, Faculty of Tourism, University of Social Sciences and Humanities, VNU, 2006
7. Hai Phong Center for Social Sciences and Humanities, Some typical cultural heritages of Hai Phong, Hai Phong Publishing House, 2001
8. Nguyen Ngoc Thao (editor-in-chief, Tourism Geography, Hai Phong Publishing House, two volumes (2001-2002)
9. Nguyen Minh Tue and group of authors, Hai Phong Tourism Geography, Ho Chi Minh City Publishing House, 1997.
10. Nguyen Thanh Son, Hai Phong Tourism Territory Organization, Associate Doctoral Thesis in Geological Geography, Hanoi, 1996.
11. Decision No. 2033/QD – UB on detailed planning of Tien Lang town, Hai Phong city until 2020.
12. Department of Culture, Information, Hai Phong Museum, Hai Phong relics
- National ranked scenic spot, Hai Phong Publishing House, 2005. 13. Tien Lang District People's Committee, Economic Development Planning -
Culture - Society of Tien Lang district to 2010.
14.Website www.HaiPhong.gov.vn
APPENDIX 1
List of national ranked monuments
STT
Name of the monument
Number, year of decisiondetermine
Location
1
Gam Temple
938 VH/QĐ04/08/1992
Cam Khe Village- Toan Thang commune
2
Doc Hau Temple
9381 VH/QĐ04/08/1992
Doc Hau Village –Toan Thang commune
3
Cuu Doi Communal House
3207 VH/QĐDecember 30, 1991
Zone II of townTien Lang
4
Ha Dai Temple
938 VH/QĐ04/08/1992
Ha Dai Village –Tien Thanh commune
APPENDIX II
STT
Name of the monument
Number, year of decision
Location
1
Phu Ke Pagoda Temple
178/QD-UBJanuary 28, 2005
Zone 1 - townTien Lang
2
Trung Lang Temple
178/QD-UBJanuary 28, 2005
Zone 4 – townTien Lang
3
Bao Khanh Pagoda
1900/QD-UBAugust 24, 2006
Nam Tu Village -Kien Thiet commune
4
Bach Da Pagoda
1792/QD-UB11/11/2002
Hung Thang Commune
5
Ngoc Dong Temple
177/QD-UBNovember 27, 2005
Tien Thanh Commune
6
Tomb of Minister TSNhu Van Lan
2848/QD-UBSeptember 19, 2003
Nam Tu Village -Kien Thiet commune
7
Canh Son Stone Temple
2160/QD-UBSeptember 19, 2003
Van Doi Commune –Doan Lap
8
Meiji Temple
2259/QD-UBSeptember 19, 2002
Toan Thang Commune
9
Tien Doi Noi Temple
477/QD-UBSeptember 19, 2005
Doan Lap Commune
10
Tu Doi Temple
177/QD-UBJanuary 28, 2005
Doan Lap Commune
11
Duyen Lao Temple
177/QD-UBJanuary 28, 2005
Tien Minh Commune
12
Dinh Xuan Uc Pagoda
177/QD-UBJanuary 28, 2005
Bac Hung Commune
13
Chu Khe Pagoda
177/QD-UBJanuary 28, 2005
Hung Thang Commune
14
Dong Dinh
2848/QD-UBNovember 21, 2002
Vinh Quang Commune
15
President's Memorial HouseTon Duc Thang
177/QD-UBJanuary 28, 2005
NT Quy Cao
Ha Dai Temple
Ben Vua Temple
Tien Lang hot spring
div.maincontent .p { color: black; font-family:"Times New Roman", serif; font-style: normal; font-weight: normal; text-decoration: none; font-size: 14pt; margin:0pt; } div.maincontent p { color: black; font-family:"Times New Roman", serif; font-style: normal; font-weight: normal; text-decoration: none; font-size: 14pt; margin:0pt; } div.maincontent .s1 { color: black; font-family:"Times New Roman", serif; font-style: normal; font-weight: normal; font-size: 16pt; } div.maincontent .s2 { color: black; font-family:"Times New Roman", serif; font-style: italic; font-weight: bold; text-decoration: none; font-size: 14pt; } div.maincontent .s3 { color: black; font-family:"Times New Roman", serif; font-style: italic; font-weight: normal; text-decoration: none; font-size: 14pt; } div.maincontent .s4 { color: black; font-family:"Times New Roman", serif; font-style: normal; font-weight: normal; font-size: 14pt; } div.maincontent .s5 { color: black; font-family:"Times New Roman", serif; font-style: normal; font-weight: bold; font-size: 14pt; } div.maincontent .s6 { color: black; font-family:"Times New Roman", serif; font-style: normal; font-weight: normal; text-decoration: none; font-size: 14pt; } div.maincontent .s7 { color: black; font-family:"Times New Roman", serif; font-style: normal; font-weight: bold; text-decoration: none; font-size: 14pt; } div.maincontent .s8 { color: black; font-family:"Times New Roman", serif; font-style: normal; font-weight: normal; text-decoration: none; font-size: 9pt; vertical-align: 6pt; } div.maincontent .s9 { color: black; font-family:"Times New Roman", serif; font-style: normal; font-weight: bold; text-decoration: none; font-size: 12pt; } div.maincontent .s11 { color: black; font-family:"Times New Roman", serif; font-style: normal; font-weight: normal; tex
Solutions for tourism development in Tien Lang - 10
zt2i3t4l5ee
zt2a3gstourism, tourism development
zt2a3ge
zc2o3n4t5e6n7ts
- District People's Committees and authorities of communes with tourist attractions should support, promote, and provide necessary information to people, helping them improve their knowledge about tourism. Raise tourism awareness for local people.
*
* *
Due to limited knowledge and research time, the thesis inevitably has shortcomings. Therefore, I look forward to receiving guidance from teachers, experts as well as your comments to make the thesis more complete.
Chapter III Conclusion
Through the issues presented in Chapter II, we can come to some conclusions:
Based on the strengths of available tourism resources, the types of tourism in Tien Lang that need to be promoted in the coming time are sightseeing and resort tourism, discovery tourism, weekend tourism. To improve the quality and diversify tourism products, Tien Lang district needs to combine with local cultural tourism resources, at the same time combine with surrounding areas, build rich tourism products. The strengths of Tien Lang tourism are eco-tourism and cultural tourism, so developing Tien Lang tourism must always go hand in hand with restoring and preserving types of cultural tourism resources. Some necessary measures to support and improve the efficiency of exploiting tourism resources in Tien Lang are: strengthening the construction of technical facilities and labor force serving tourism, actively promoting and advertising tourism, and expanding forms of capital mobilization for tourism development.
CONCLUDE
I Conclusion
1. Based on the results achieved within the framework of the thesis's needs, some basic conclusions can be drawn as follows:
Tien Lang is a locality with great potential for tourism development. The relatively abundant cultural tourism resources and ecological tourism resources have great appeal to tourists. Based on this potential, Tien Lang can build a unique tourism industry that is competitive enough with other localities within Hai Phong city and neighboring areas.
In recent years, the exploitation of the advantages of resources to develop tourism and build tourist routes in Tien Lang has not been commensurate with the available potential. In terms of quantity, many resource objects have not been brought into the purpose of tourism development. In terms of time, the regular service time has not been extended to attract more visitors. Infrastructure and technical facilities are still weak. The labor force is still thin and weak in terms of expertise. Tourism programs and routes have not been organized properly, the exploitation content is still monotonous, so it has not attracted many visitors. Although resources have not been mobilized much for tourism development, they are facing the risk of destruction and degradation.
2. Based on the results of investigation, analysis, synthesis, evaluation and selective absorption of research results of related topics, the thesis has proposed a number of necessary solutions to improve the efficiency of exploiting tourism resources in Tien Lang such as: promoting the restoration and conservation of tourism resources, focusing on investment and key exploitation of ecotourism resources, strengthening the construction of infrastructure and tourism workforce. Expanding forms of capital mobilization. In addition, the thesis has built a number of tourist routes of Hai Phong in which Tien Lang tourism resources play an important role.
Exploiting Tien Lang tourism resources for tourism development is currently facing many difficulties. The above measures, if applied synchronously, will likely bring new prospects for the local tourism industry, contributing to making Tien Lang tourism an important economic sector in the district's economic structure.
REFERENCES
1. Nhuan Ha, Trinh Minh Hien, Tran Phuong, Hai Phong - Historical and cultural relics, Hai Phong Publishing House, 1993
2. Hai Phong City History Council, Hai Phong Gazetteer, Hai Phong Publishing House, 1990.
3. Hai Phong City History Council, History of Tien Lang District Party Committee, Hai Phong Publishing House, 1990.
4. Hai Phong City History Council, University of Social Sciences and Humanities, VNU, Hai Phong Place Names Encyclopedia, Hai Phong Publishing House. 2001.
5. Law on Cultural Heritage and documents guiding its implementation, National Political Publishing House, Hanoi, 2003.
6. Tran Duc Thanh, Lecture on Tourism Geography, Faculty of Tourism, University of Social Sciences and Humanities, VNU, 2006
7. Hai Phong Center for Social Sciences and Humanities, Some typical cultural heritages of Hai Phong, Hai Phong Publishing House, 2001
8. Nguyen Ngoc Thao (editor-in-chief, Tourism Geography, Hai Phong Publishing House, two volumes (2001-2002)
9. Nguyen Minh Tue and group of authors, Hai Phong Tourism Geography, Ho Chi Minh City Publishing House, 1997.
10. Nguyen Thanh Son, Hai Phong Tourism Territory Organization, Associate Doctoral Thesis in Geological Geography, Hanoi, 1996.
11. Decision No. 2033/QD – UB on detailed planning of Tien Lang town, Hai Phong city until 2020.
12. Department of Culture, Information, Hai Phong Museum, Hai Phong relics
- National ranked scenic spot, Hai Phong Publishing House, 2005. 13. Tien Lang District People's Committee, Economic Development Planning -
Culture - Society of Tien Lang district to 2010.
14.Website www.HaiPhong.gov.vn
APPENDIX 1
List of national ranked monuments
STT
Name of the monument
Number, year of decisiondetermine
Location
1
Gam Temple
938 VH/QĐ04/08/1992
Cam Khe Village- Toan Thang commune
2
Doc Hau Temple
9381 VH/QĐ04/08/1992
Doc Hau Village –Toan Thang commune
3
Cuu Doi Communal House
3207 VH/QĐDecember 30, 1991
Zone II of townTien Lang
4
Ha Dai Temple
938 VH/QĐ04/08/1992
Ha Dai Village –Tien Thanh commune
APPENDIX II
STT
Name of the monument
Number, year of decision
Location
1
Phu Ke Pagoda Temple
178/QD-UBJanuary 28, 2005
Zone 1 - townTien Lang
2
Trung Lang Temple
178/QD-UBJanuary 28, 2005
Zone 4 – townTien Lang
3
Bao Khanh Pagoda
1900/QD-UBAugust 24, 2006
Nam Tu Village -Kien Thiet commune
4
Bach Da Pagoda
1792/QD-UB11/11/2002
Hung Thang Commune
5
Ngoc Dong Temple
177/QD-UBNovember 27, 2005
Tien Thanh Commune
6
Tomb of Minister TSNhu Van Lan
2848/QD-UBSeptember 19, 2003
Nam Tu Village -Kien Thiet commune
7
Canh Son Stone Temple
2160/QD-UBSeptember 19, 2003
Van Doi Commune –Doan Lap
8
Meiji Temple
2259/QD-UBSeptember 19, 2002
Toan Thang Commune
9
Tien Doi Noi Temple
477/QD-UBSeptember 19, 2005
Doan Lap Commune
10
Tu Doi Temple
177/QD-UBJanuary 28, 2005
Doan Lap Commune
11
Duyen Lao Temple
177/QD-UBJanuary 28, 2005
Tien Minh Commune
12
Dinh Xuan Uc Pagoda
177/QD-UBJanuary 28, 2005
Bac Hung Commune
13
Chu Khe Pagoda
177/QD-UBJanuary 28, 2005
Hung Thang Commune
14
Dong Dinh
2848/QD-UBNovember 21, 2002
Vinh Quang Commune
15
President's Memorial HouseTon Duc Thang
177/QD-UBJanuary 28, 2005
NT Quy Cao
Ha Dai Temple
Ben Vua Temple
Tien Lang hot spring
div.maincontent .p { color: black; font-family:"Times New Roman", serif; font-style: normal; font-weight: normal; text-decoration: none; font-size: 14pt; margin:0pt; } div.maincontent p { color: black; font-family:"Times New Roman", serif; font-style: normal; font-weight: normal; text-decoration: none; font-size: 14pt; margin:0pt; } div.maincontent .s1 { color: black; font-family:"Times New Roman", serif; font-style: normal; font-weight: normal; font-size: 16pt; } div.maincontent .s2 { color: black; font-family:"Times New Roman", serif; font-style: italic; font-weight: bold; text-decoration: none; font-size: 14pt; } div.maincontent .s3 { color: black; font-family:"Times New Roman", serif; font-style: italic; font-weight: normal; text-decoration: none; font-size: 14pt; } div.maincontent .s4 { color: black; font-family:"Times New Roman", serif; font-style: normal; font-weight: normal; font-size: 14pt; } div.maincontent .s5 { color: black; font-family:"Times New Roman", serif; font-style: normal; font-weight: bold; font-size: 14pt; } div.maincontent .s6 { color: black; font-family:"Times New Roman", serif; font-style: normal; font-weight: normal; text-decoration: none; font-size: 14pt; } div.maincontent .s7 { color: black; font-family:"Times New Roman", serif; font-style: normal; font-weight: bold; text-decoration: none; font-size: 14pt; } div.maincontent .s8 { color: black; font-family:"Times New Roman", serif; font-style: normal; font-weight: normal; text-decoration: none; font-size: 9pt; vertical-align: 6pt; } div.maincontent .s9 { color: black; font-family:"Times New Roman", serif; font-style: normal; font-weight: bold; text-decoration: none; font-size: 12pt; } div.maincontent .s11 { color: black; font-family:"Times New Roman", serif; font-style: normal; font-weight: normal; tex -
 Ho Chi Minh 1995: Complete Works. - National Political Publishing House, Hanoi, Volume 3. 10. Nguyen Thi Anh Thu, Psychological and Social Characteristics of Semi-Immigrants
 -
 Political quality education for students of National Defense and Security Education Center - Thai Nguyen University - 2
 -
 Comparison of the Organization of the 2013 National Tourism Year Event in Hai Phong with Some Other Provinces and Cities That Previously Hosted the National Tourism Year
 -
 Building a Strength Development Training Plan for 15-16 Year Old Male Weightlifters of the National Youth Team
Source: Measuring the impact of trade liberalization in Vietnam, ministerial research project number B2003-38-67
PL-2.7: Import, export, consumption and production of inorganic fertilizers in EU15 in 1995/96
Value (billion euros) | Mass (million tons of products) | |
Import | 1.8 | 13.4 |
Export | 0.6 | 4.4 |
Output | 6.5 | 50 |
Demand | 7.7 | 59 |
Source: Eurostat
PL-2.8: EU consumption and imports of nitrogen fertilizers 15
period 1992/93-1997/98.
Source: EFMA/EUROSTAT
1995/96
1992/93
300
250
200
150
100
50
0
Series1 Series2
EU15 average inorganic fertilizer use
95/96 and 92/93 (kg/ha)
PL-2.9: EU15 Average Inorganic Fertilizer Use Rate 1995/96 & 1992/93 (kg/ha)
Netherlands
Belgium/Lux
Finland
France
Virtue
Ireland
Denmark
Older brother
Sweden
Italy
Spain
shirt
Greece
Portugal
PL-2.10: EU15 inorganic fertilizer consumption forecast
Source: EFMA/EUROSTAT
EU15 inorganic fertilizer consumption forecast (million tonnes of nutrients) | ||||||
Year | N | P2O5 | K2O | |||
Consumption | Change (%) | Consumption | Change (%) | Consumption | Change (%) | |
1995/1996 | 9,676 | 3,562 | 4,234 | |||
2000/2001 | 9,259 | -4.3 | 3,398 | -4.6 | 3,951 | -6.7 |
2005/2006 | 9,171 | -5.2 | 3,399 | -4.6 | 4,007 | -5.4 |
Source: EFMA, (1996)
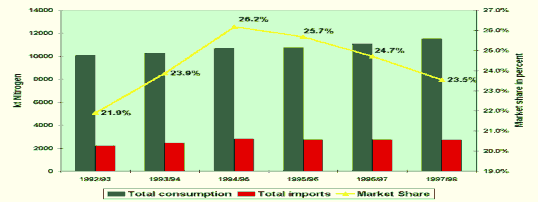
PL-2.11: EU15 annual nitrogen fertilizer consumption and imports 1989/90-1997/98.
Year
Amount of consumption use N (million tons) | Amount of NK N (million tons) | Ratio Import/Consumption N | Amount of NK N from CEE/CIS (million tonnes) | Import/export ratio use N from CEE/CIS | |
1989/90 | 11.0 | 1.5 | 13.6% | 0.55 | 5% |
1990/91 | 10.0 | 2.1 | 21% | 1.1 | 11% |
1991/92 | 9.6 | 1.95 | 20.3% | 1.15 | 12% |
1992/93 | 9.05 | 1.98 | 21.9% | 1.45 | 16% |
1993/94 | 10.3 | 2.46 | 23.9% | 1.75 | 17% |
1994/95 | 9.5 | 2.5 | 26.2% | 1.8 | 19% |
1995/96 | 9.68 | 2.5 | 25.7% | 2.03 | 21% |
1996/97 | 10.93 | 2.7 | 24.7% | ||
1997/98 | 11.6 | 2.73 | 23.5% |
Source: EFMA
Fertilizer consumption and import
of EU1989/1997 (million tonnes)
PL-2.12: EU15 fertilizer N consumption and imports 1989/90-1997/98.
14
12
10
8
6
4
2
0
1990 1991 1992 1993
1994
Year
1995 1996 1997 1998
Source: EFMA/EUROSTAT
PL-2.13: Level of use and cost of alternative inputs for ammonia production
Natural gas | Heavy kerosene | Charcoal | |
Energy costs | 1.0 | 1.3 | 1.7 |
Investment costs | 1.0 | 1.4 | 2.4 |
Production cost | 1.0 | 1.2 | 1.7 |
Source: EFMA, 2004
PL-2.14: Comparison of competitive advantages between some major nitrogen fertilizer producing countries and regions in the world today
EU | China | Russia | Central and Eastern Europe | America | Middle East | |
Technology | Modern | Many factories small | Need to change | Need to change | Modern | Modern |
Input | Mainly natural gas of course | Mainly coal | Natural gas | Mainly natural gas of course | Natural gas | Natural gas |
Energy costs | High | Lack cheap energy | Short | High/medium | Medium | Very low |
Effective energy | High | short | short | medium | High | High |
CO 2 emissions / unit N | short | very high | High | high/medium | short | Short |
Gas price
High | High | Low/Medium | Medium | High | Short | |
Safety & Requirements environment | High | Short | Short | Low/medium | High | High/medium |
Logistics | have advantage | have transportation problems | air ports effective | little advantage | have advantage | have advantage |
Market Access school | near the | near the | distant | close to medium | near the | distant |
Profit 1995 | central jar | short | very low | low/medium jar | High | High |
PL-2.15: World economic growth 1996-2005
Source: IFA, 2004
Developed economies
Developing economies
GDP growth ( %)
World
Source: IMF, 2004
PL-2.16: World demand for inorganic fertilizers in 2002/03, 2003/04 and forecast for 2004/05
Unit: 1000 tons
Basic nutrients
2002/03 | 2003/04 | Change 2003/04 vs 2002/03 (%) | 2004/05 | Change 2004/05 vs 2003/04 (%) | |
N | 84944 | 85868 | 1.1% | 88252 | 2.8% |
P2O5 | 33791 | 34651 | 2.5% | 35637 | 2.8% |
K2O | 23776 | 24986 | 5.1% | 25897 | 3.6% |
Total | 142512 | 145505 | 2.1% | 149786 | 2.5% |
Source: IFIA
PL-3.1: Results of Vietnam's agricultural production in the period 1981-1985:
Target
Average 1981-1985 | Compare 1981-1985 average with 1976-1980 average (%) | |
Food output in paddy equivalent (million tons) | 16.9 | 127 |
Rice yield per crop (quintal/ha) | 24.25 | 123 |
Average food (kg/person) | 295 | 114 |
Source: Vietnam Agriculture in Sustainable Development, Dr. Nguyen Tu, National Political Publishing House, 2004.
PL-3.2: Grain production achieved during the period 1990-2004.
Year
Output (thousand tons) | Speed of increase (%) | Rice growing area (Thousand hectares) | Annual rice yield (tons/ha) | Average SL LT per capita (kg) | Speed of increase (%) | |
1990 | 19896.1 | 0.3 | 6042.8 | 31.8 | 301.4 | -1.6 |
1991 | 20293.9 | 2.0 | 6302.8 | 31.1 | 301.8 | 0.1 |
1992 | 22338.3 | 10.1 | 6475.3 | 33.3 | 326.3 | 8.1 |
1993 | 23718.7 | 6.2 | 6559.4 | 34.8 | 340.6 | 4.4 |
1994 | 24672.1 | 4.0 | 6598.6 | 35.7 | 348.4 | 2.3 |
1995 | 26140.9 | 6.0 | 6765.6 | 36.9 | 363.1 | 4.2 |
1996 | 27933.4 | 6.9 | 7003.8 | 37.7 | 381.8 | 5.2 |
1997 | 29174.5 | 4.4 | 7099.7 | 38.8 | 392.6 | 2.8 |
1998 | 30757.5 | 5.4 | 7362.7 | 39.6 | 407.6 | 3.8 |
1999 | 33146.9 | 7.8 | 7648.1 | 41.0 | 432.7 | 6.2 |
2000 | 34535.4 | 4.2 | 7655.4 | 42.4 | 444.8 | 2.8 |
2001 | 34270.1 | -0.8 | 7492.7 | 42.9 | 435.5 | -2.1 |
2002 | 36958.4 | 6.1 | 7504.3 | 45.9 | 463.6 | 4.8 |
2003 | 37452.3 | 4.0 | 7449.3 | 46.3 | 464.8 | 2.3 |
2004 | 39322.9 | 4.1 | 7328.0 | 48.6 | 479.1 | 2.6 |
2005 | 39549.0 | 48.9 | ||||
2006 | 39648.0 | 49.3 |
Source: 1. Vietnam Economic Times 2. Science and Technology Agriculture and Rural Development
20 years of innovation, National Political Publishing House, 2005.
PL-3.3: Some basic economic indicators of Vietnam in the period 1991-2005
Year
GDP (trillion VND) | GDP growth rate (%) | GDP (billion USD) | Export value (billion USD) | Export/Import ratio GDP | Inflationary | Exchange rate VND/USD | |
1991 | 76,707 | 5.81 | 8,271 | 2,0871 | 25.2 | 67.4 | 9274 |
1992 | 110,050 | 8.70 | 9,870 | 2,5807 | 26.1 | 17.5 | 11150 |
1993 | 136,570 | 8.08 | 12,836 | 2,9852 | 23.3 | 5.2 | 10640 |
1994 | 170,260 | 8.83 | 15,542 | 4,0543 | 26.1 | 14.4 | 10955 |
1995 | 228,891 | 9.54 | 20,714 | 5,4489 | 26.3 | 12.7 | 11050 |
1996 | 272,030 | 9.34 | 24,556 | 7,2559 | 29.5 | 4.5 | 11078 |
1997 | 313,624 | 8.15 | 26,114 | 9,1850 | 35.0 | 3.6 | 12010 |
1998 | 368,690 | 5.76 | 27,310 | 9,3603 | 34.3 | 9.2 | 13500 |
1999 | 399,942 | 4.77 | 28,365 | 11,5414 | 40.7 | 0.1 | 14100 |
2000 | 441,800 | 6.79 | 31,347 | 14,4830 | 46.2 | -0.6 | 14094 |
2001 | 481,300 | 6.89 | 32,686 | 15,0290 | 46.0 | 0.8 | 14725 |
2002 | 536,100 | 7.08 | 35,085 | 16,7061 | 47.6 | 4.0 | 15280 |
2003 | 613,400 | 7.34 | 38,974 | 20,1493 | 51.8 | 3.0 | 15536 |
2004 | 715,300 | 7.79 | 45,295 | 26,5042 | 57.4 | 9.5 | 15750 |
2005 | 837,900 | 8.43 | 52,731 | 32,2330 | 61.1 | 8.6 | 15890 |
Source: Vietnam Economic Times
PL-3.3 (continued)
Year
Population (thousand people) | Growth rate (%) | Fertilizer output (thousand tons) | Fertilizer imports (thousand tons) | Pesticide imports (million USD) | |||
Total | urea | Total | urea | ||||
1991 | 67242.4 | 1.86 | 44,890 | 2663 | 1080 | 23 | |
1992 | 68450.1 | 1.80 | 82,633 | 2420 | 424 | 24 | |
1993 | 69644.5 | 1.74 | 100,093 | 3018 | 1250 | 33 | |
1994 | 70824.5 | 1.69 | 103,222 | 4134 | 1543 | 59 | |
1995 | 71995.5 | 1.65 | 110,972 | 2316.9 | 1356 | 100.4 | |
1996 | 73156.7 | 1.61 | 965 | 120,471 | 2630 | 1467 | 89 |
1997 | 74306.9 | 1.57 | 982 | 130,170 | 2527 | 1480 | 130 |
1998 | 75456.3 | 1.55 | 978 | 63,905 | 3448 | 1944 | 126.3 |
1999 | 76569.7 | 1.51 | 1143.1 | 48,769 | 3702.9 | 1893 | 133.1 |
2000 | 77635.4 | 1.36 | 1209.5 | 76,145 | 3971.3 | 2108, 3 | 143.5 |
2001 | 78685.8 | 1.35 | 1065.1 | 98,971 | 3288 | 1652 | 102.8 |
2002 | 79727.4 | 1.32 | 2640.1 | 107,141 | 3820 | 1818 | 116.5 |
2003 | 80902.4 | 1.47 | 3001.0 | 148,196 | 4119 | 1943 | 116 |
2004 | 82032.3 | 1.40 | 3490.0 | 390,000 | 4079 | 1708 | 210 |
2005 | 83121.7 | 1.33 | 4320.0 | 860,000 | 2908 | 883 | 244 |
Source: Vietnam Economic Times, Vietnam Ministry of Trade, Ha Bac Fertilizer and Chemical Company - 45 years of construction and growth (1960-2005)
PL-3.4: Urea and NPK fertilizer output of Ha Bac nitrogen fertilizer factory in the period 1986-2005, [20]
Year
urea (ton) | NPK (ton) | Year | urea (ton) | NPK (ton) | |
1986 | 16862 | 11884 | 1996 | 120471 | 4775 |
1987 | 19600 | 21769 | 1997 | 130170 | 3472 |
1988 | 33006 | 14460 | 1998 | 63905 | 6920 |
1989 | 25762 | 3480 | 1999 | 48769 | 14259 |
1990 | 23603 | 3886 | 2000 | 76145 | 7260 |
1991 | 44890 | 8568 | 2001 | 98971 | 9639 |
1992 | 82633 | 6940 | 2002 | 107141 | 9592 |
1993 | 100093 | 3211 | 2003 | 148196 | 12501 |
1994 | 103222 | 4045 | 2004 | 162268 | 11465 |
1995 | 110972 | 3190 | 2005 | 160000 | 15000 |
Source: Ha Bac Fertilizer and Chemical Company - 45 years of construction and growth (1960-2005)
PL-3.5: Fertilizer output and import of Vietnam in the period 2000-2005
Unit: 1,000 tons;
Type of fertilizer
2000 | 2001 | 2002 | 2003 | 2004 | 2005 | |
Urea fertilizer | 76 | 99 | 107 | 148 | 390 | 880 |
Phosphate fertilizers of all kinds | 1,017 | 1,027 | 1,050 | 1.155 | 1,250 | 1450 |
NPK fertilizer | 1,209 | 1,100 | 1,500 | 1,700 | 1,850 | 2,000 |
Total output | 2,302 | 2,226 | 2,657 | 3.001 | 3,490 | 4320 |
Import volume | 3,971 | 3,288 | 3,820 | 4.119 | 4,079 | 2,908 |
Source: Ministry of Trade, Department of Planning and Investment