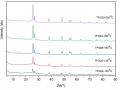
BAlLa-x, BAlFe-xd have high spectral peak intensity and narrow spectral peak. From Figure 3.19, it can be seen that the spectral peak intensity increases when the aging time of Al/M polyoxocation solution increases from 1 day to 14 days and decreases when the time increases to 21 days. Samples BAlLa- 14d, BAlFe-14d have high spectral peak intensity, narrow and sharp spectral peak. This proves that Al/M polyoxocation is stable and distributed homogeneously in the interlayer space of bentonite when the aging time of Al/M polyoxocation solution is modified for 14 days. This result is consistent with the study of Shatai et al. [114, 115] who investigated the aging time of Al/La polyoxocation solution on the properties of BAlLa material. The author believes that the suitable aging time of Al/La polyoxocation solution to prepare BAlLa material is from 2 to 3 weeks at room temperature.
Table 3.19 . d001 values and interlayer spacing of BAlLa-xd and BAlFe-xd
preparation with different aging times of Al/M polyoxocation solutions
Clay sample
2θ (o) | d001 (Å) | ∆ d (Å) | Clay sample | 2θ (o) | d001 (Å) | ∆ d (Å) | |
BALa-1d | 5,213 | 16.94 | 7.34 | BAlFe-1d | 5,016 | 17.60 | 8.00 |
BAlLa-7d | 4,820 | 18.32 | 8.72 | BAlFe-7d | 4,859 | 18.17 | 8.52 |
BAlLa-14d | 4,682 | 18.85 | 9.20 | BAlFe-14d | 4,825 | 18.30 | 8.70 |
BAlLa-21d | 4,762 | 18.54 | 8.94 | BAlFe-21d | 4,878 | 18.10 | 8.50 |
Maybe you are interested!
-
 Xrd Diagrams Of Hydrothermal Tfg20 Samples At Different Temperatures
 -
 When Should a Healthy Child Get the First Dose of Hepatitis B Vaccine? (Check Only One)
 -
 Two Elements A And B Are In Two Consecutive Main Groups In The Periodic System. In Their Pure Substance State, A And B Do Not React With Each Other. Total Number Of Protons
 -
 Effects of Voltage (A); Kcl Concentration (B); Electrolysis Time (C); and Stirring Time (D) on Hg Signal (Ii)
 -
 Equations Expressing the Relationship Dt/d1,3 In the Form: Dt = A + B.d1,3 At Different Ages
From Table 3.19, it can be seen that the layer spacing of BAlLa-xd and BAlFe-xd increased when the aging time of Al/M polyoxocation solution increased from 1 day to 14 days. Then, the d 001 value decreased when the aging time of this solution increased to 21 days.
The BAlLa-xd sample has a characteristic peak at angle 2θ = 5.213 ÷ 4.682o, corresponding to the range
The layer spacing is 16.94 ÷ 18.85Å and the interlayer spacing is 7.34 ÷ 9.25Å. While
The d001 value of BAlFe-xd is in the range of 17.60 ÷ 18.30Å and the distance
The interlayer is 8.00 ÷ 8.70Å. The ∆d values of BAlLa-xd and BAlFe-xd are higher than the
The average height of the aluminum Keggin ion (8.6Å) suggests that the Al/La polyoxocation and Al/Fe polyoxocation modifiers in the interlayer of BAlLa and BAlFe have a Keggin ion-type structure [90].
3.4.1.4. Temperature influence of the denaturation process
The experimental conditions are described in section 2.3.2, with the aging time of Al/M polyoxocation solution being 14 days at room temperature, and the denaturation reaction being carried out at different temperatures. The XRD patterns of BAlLa-Tx and BAlFe-Tx (x = 25; 50; 70 and 90oC) are given in Figure 3.20. The values of 2θ, d001 and the interlayer spacing of BAlLa-Tx and BAlFe-Tx are shown in Table 3.20.
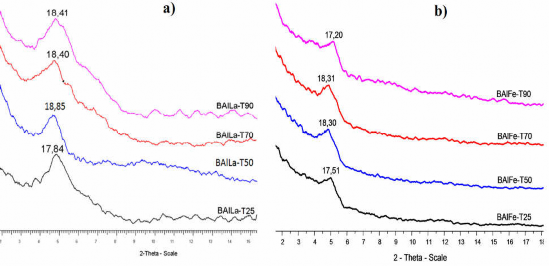
Figure 3.20. XRD patterns of samples a) BAlLa-Tx and b) BAlFe-Tx prepared at room temperature
different.
The peak intensity of BAlLa-Tx and BAlFe-Tx does not change much when the reaction temperature changes from 25 to 90oC as shown in Figure 3.20. From Figure 3.20, it can be seen that the BAlLa-T50 and BAlFe-T70 samples have high peak intensity, narrow and sharp peaks. Thus, conducting the reaction at low temperature (25oC) and high temperature (90o) is not suitable for the process of modifying bentonite with polyoxocation Al/La and polyoxocation Al/Fe to prepare BAlLa and BAlFe materials.
From Table 3.20, it can be seen that the layer spacing of BAlLa-Tx and BAlFe-Tx prepared at 50oC and 70oC is greater than 18Å. In which, the d001 value of BAlLa-T50 and BAlFe-T70 is 18.85Å and 18.31Å, the largest. Combined with the peak intensity shown in Figure 3.20, the suitable temperature to conduct the reaction to prepare BAlLa and BAlFe is 50oC and 70oC.
Table 3.20 . d001 values and interlayer spacing of BAlLa-Tx and BAlFe-Tx
prepared at different temperatures
Clay sample
2θ (o) | d001 (Å) | ∆ d (Å) | Clay sample | 2θ (o) | d001 (Å) | ∆ d (Å) | |
BAlLa-T25 | 4,949 | 17.84 | 8.24 | BAlFe-T25 | 5,043 | 17.51 | 7.91 |
BAlLa-T50 | 4,682 | 18.85 | 9.20 | BAlFe-T50 | 4,825 | 18.30 | 8.70 |
BAlLa-T70 | 4,798 | 18.40 | 8.80 | BAlFe-T70 | 4,824 | 18.31 | 8.71 |
BAlLa-T90 | 4,796 | 18.41 | 8.81 | BAlFe-T90 | 5,133 | 17.20 | 7.60 |
3.4.1.5. Effect of molar ratio OH-/(Al3++M3+)
The samples were prepared under the optimal conditions investigated above. To investigate the effect of the OH-/(Al3++M3+) ratio on the product structure, the experimental procedure is presented in section 2.3.2. The denaturation reaction was carried out at 50oC (BAlLa) and 70oC (BAlFe), with the molar ratio of OH-/(Al3++M3+) varying from 1.0 to 2.5. The XRD patterns of BAlLa-OH-x and BAlFe-OH-x (x = 1.0; 1.5; 2.0 and 2.5) are shown in Figure 3.21. The d 001 values and interlayer distances of BAlLa-OH-x and BAlFe-OH-x are presented in Table 3.21.
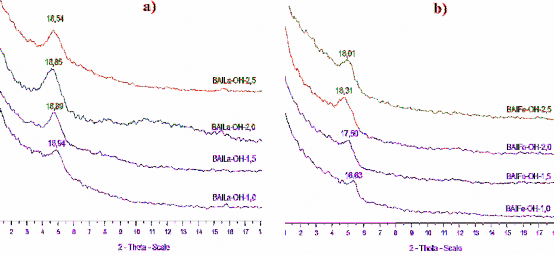
Figure 3.21. XRD patterns of a) BAlLa-OH-x and b) BAlFe-OH-x prepared at different OH-/(Al3++M3+) molar ratios.
The molar ratio of OH-/(Al3++M3+) affects the intensity and width of the spectral peaks as well as the layer spacing of the BAlLa-OH-x and BAlFe-OH-x samples as shown in Figure 3.21. From the results shown in Figure 3.21, it can be seen that the intensity of the spectral peaks
BAlLa-OH-x and BAlFe-OH-x increased when the molar ratio of OH-/(Al3++M3+) increased from 1.0 to 2.0 and then the peak intensity decreased when the ratio increased to 2.5. The BAlLa-OH-2.0 and BAlFe-OH-2.0 samples had higher spectral peak intensity, narrower and sharper peaks than the samples prepared with other molar ratios of OH-/(Al3++M3+). Thus, the molar ratio of OH-/(Al3++M3+) was 2.0, which was suitable for the formation of large-sized, stable Al/La and Al/Fe polyoxocation agents with Keggin-type ion structure [22, 90].
Table 3.21 . d001 values and interlayer distances of BAlLa-OH-x and BAlFe- OH-x prepared at different OH-/(Al3++M3+) molar ratios
Clay sample
2θ (o) | d001(Å) | ∆ d (Å) | Clay sample | 2θ (o) | d001(Å) | ∆ d (Å) | |
BALa-OH-1,0 | 5,213 | 16.94 | 7.34 | BAlFe-OH-1.0 | 5,309 | 16.63 | 7.03 |
BALa-OH-1,5 | 4,673 | 18.89 | 9.29 | BAlFe-OH-1,5 | 5,046 | 17.50 | 7.90 |
BALa-OH-2,0 | 4,683 | 18.85 | 9.25 | BAlFe-OH-2.0 | 4,824 | 18.31 | 8.71 |
BALa-OH-2,5 | 4,762 | 18.54 | 8.94 | BAlFe-OH-2,5 | 4,904 | 18.01 | 8.40 |
∆d = d001 − 9.6 (Å)
From Table 3.21, it can be seen that Al/La modified bentonite has a characteristic spectral peak at the layer spacing of 16.94 ÷ 18.86Å and the interlayer spacing of 7.34 ÷ 9.29Å. The BAlLa-OH-1.0 sample has a d 001 value of 16.94Å, much smaller than the prepared samples.
with high OH-/(Al3++La3+) molar ratio. This can be explained by the hydrolysis of the solution.
The polyoxocation solution forming the Keggin ion-type structure did not occur completely. The d 001 value of BAlLa-OH-2.0 was lower than that of BAlLa-OH-1.5 sample, but the intensity of the spectral peak was much higher. The obtained results were consistent with the studies of some authors on Al/La modified bentonite [130, 140, 158].
The layer spacing of BAlFe-OH-x increases as the molar ratio OH-/(Al3++Fe3+) increases from
1.0 to 2.0 and then decreased as the ratio increased to 2.5 as shown in Table 3.21. The BAlFe-OH-1.0 and BAlFe-OH-1.5 samples had low peak intensity, broad peak, and smaller d 001 values than the BAlFe-OH-2.0 and BAlFe-OH-2.5 samples. BAlFe-OH-2.0 had a layer spacing of 18.31Å, which was the largest among the other BAlFe-OH-x samples. The d 001 value of Al/Fe modified bentonite was consistent with the studies of Zhu [161] and Thomas [128,
129]. From the d 001 value shown in Table 3.21, the intensity and width of the spectral peaks shown in Figure 3.21, the molar ratio of OH-/(Al3++M3+) of 2.0 is considered as the optimal synthesis condition.
3.4.2. Evaluation of physical and chemical properties of BAlLa and BAlFe materials
3.4.2.1. Chemical composition and surface area
The mass percentage, surface area and total pore volume of BAlLa and BAlFe are shown in Table 3.22. The BAlLa sample has higher mass percentages of Al2O3 and La than the B90 sample (Table 3.2). But the Al2O3 mass percentage of BAlLa is lower than that of the BAl sample (Table 3.15) and the La percentage is also lower than that of the B90-La sample (Table 3.9). The Fe2O3 mass percentage in BAlFe is much higher than that of the B90 sample (Table 3.2). Besides, the mass percentages of Al2O3, La and Fe2O3 increased significantly in the BAlLa and BAlFe samples, the mass percentages of Na2O and K2O decreased significantly. The mass percentages of MgO and CaO also decreased slightly, while the other components did not change significantly. This also confirms that Binh Thuan bentonite belongs to the alkaline bentonite type with interlayer hydrated cations mainly being Na+, K+. The surface area and total pore volume also increased significantly in the BAlLa and BAlFe samples compared to the raw bentonite sample. The surface area increased from 60.72 m2/g (B90) to 181.51 m2/g (BAlLa) and 131.48 m2/g (BAlFe). Thus, it can be confirmed that the interlayer hydrated cation exchange process of bentonite clay and the polyoxocation agents Al/La and polyoxocation Al/Fe occurred [101, 121, 132].
Table 3.22. Chemical composition and surface area of BAlLa and BAlFe
% mass
BALa | BAlFe | % mass | BALa | BAlFe | |
SiO2 | 50.03 | 35.73 | K2O | 0.58 | 1.44 |
Al2O3 | 21.25 | 11.78 | MnO2 | 0.06 | 0.01 |
Fe2O3 | 6.05 | 35.03 | TiO2 | 0.41 | 0.56 |
High | 0.06 | 0.03 | P2O5 | 0.05 | 0.04 |
MgO | 1.51 | 1.21 | La | 1.97 | 0.02 |
Na2O | 0.76 | 0.59 | MKN | 15.33 | 13.56 |
SBET (m2/g) | 181.51 | 131.48 | VP (cm3/g) | 0.285 | 0.282 |
3.4.2.2. Surface properties
(MKN: loss on heating)
The results of surface morphology analysis of BAlLa, BAlFe samples by SEM method are shown in Figure 3.22. Samples B90 and BAlLa, BAlFe have different surface morphology. Sample B90 has a thin leaf structure, sharp edges and exists
face-face structure (Figure 3.1), the difference in surface morphology of BAlLa and BAlFe is due to the interlayer hydrate cations of bentonite clay being exchanged with the polyoxocation modifier during the preparation process. The structure of BAlLa exists in a flocculated form and some small bubbles appear as observed in Figure 3.22a. When the Al/Fe polyoxocation agent is inserted into the bentonite layer structure, the face-face structure is destroyed and the layered structure (edge-to-face orientation and edge-to-edge orientation) is formed (Figure 3.22b), increasing the degree of disorder of the Al/Fe modified bentonite material. As a result, the sharp leaf structure of B90 is replaced by a chaotic layered structure (with possible layering), leading to an increase in surface area (Table 3.22). These findings are consistent with the XRD analysis results of BAlLa and BAlFe samples with a broad spectral peak compared to the B90 sample [80, 122].
a)
b)
Figure 3.22. SEM images of materials a) BAlLa and b) BAlFe.
3.4.2.3. FTIR spectrum
The FTIR spectrum analysis results of BAlLa, BAlFe and B90 samples are shown in Figure 3.23. The characteristic spectral signals shown in Table 3.23 have demonstrated that the modification of aluminosilicate layers by polyoxocation Al/La and polyoxocation Al/Fe was successful. In Figure 3.23, it can be seen that the intensity of the spectral peak at 470 cm-1 of BAlLa, BAlFe is much higher than that of the spectral peak at 471 cm-1 (B90), the change in spectral peak intensity is due to the binding of Fe3+, La3+ ions into the structure of polyoxocation Al13 [70, 131, 140].
1039
3432
1034
3625
1035
918
470
3699
1636
529
693
655
783
c)
3436
3624
918
534
471
3698
1638
782
9 16
b)
3626
532
3445
1431
3698
1638
471
780 639
a)
704
1....000
0....95
0....90
0....85
0....80
0....75
0....70
0....65
0....60
0....55
0....50
0....45
0....40
0....35
0....30
0....25
0....20
0....15
0....10
0....05
0....000
4000....0 3600 3200 2800 2400 2000 1800 1600 1400 1200 1000 800 600 400....0
cm - 1
Figure 3.23 . FTIR spectra of samples a) B90, b) BAlLa and c) BAlFe .
Table 3.23. Frequency and FTIR spectral signals of BAlLa and BAlFe samples
Spectrum signal
Frequency (cm-1) | Spectrum signal | Frequency (cm-1) | |||
BALa | BAlFe | BALa | BAlFe | ||
υ /υ HO-AlVI HO-MgVI | 3624 | 3625 | δ Al-Mg-OH | 782 | 783 |
υ (H2O adsorption) HO-H | 3436 | 3432 | υ /υ Si-O-Si Si-O-Al | - | 693 |
δ (H2O adsorption) HO-H | 1638 | 1636 | δ Si-O-AlVI | 534 | 529 |
υ SiO | 1034 | 1039 | δSi-O-Si /υFe/La-O | 471 | 470 |
δ HO-AlVI | 918 | 918 | δ /δ Fe/La-O-Fe/LaAl-O-Al | 420 | 417 |
3.4.3. Conclusion on the preparation process of BAlLa, BAlFe materials
The suitable conditions for the preparation of BAlLa and BAlFe materials with the Al:La, Al:Fe ratios of 5:1 and 2:1 were determined. The ratio of (Al3++La3+)/bentonite was 15 mmol/g and (Al3++Fe3+)/bentonite was 20 mmol/g; the aging time of the Al/La and Al/Fe polyoxocation solutions was 14 days, the denaturation reaction temperature was 50oC (for BAlLa) and 70oC (BAlFe) with the molar ratio of OH-
/(Al3++La3+), OH-/(Al3++Fe3+) is 2.0.
Under these conditions, the obtained BAlLa, BAlFe materials have a layer spacing greater than 18.2Å, corresponding to an interlayer spacing greater than 8.6Å and compared with the average size of Keggin ions of 8.6Å. This shows that the Al/La polyoxocation and Al/Fe polyoxocation have a Keggin ion-type structure. The surface area and total pore volume also increased compared to the raw bentonite. This also confirms that the interlayer hydrate cations of bentonite have been exchanged and replaced by the Al/La polyoxocation and Al/Fe polyoxocation.
3.5. SURVEY OF FACTORS AFFECTING THE PHOSPHORUS ADSORPTION PROCESS OF MODIFIED BENTONITE MATERIALS
In this study, the modified bentonite material used was synthesized from Binh Thuan bentonite and the agents La, Al, Fe, Al/La and Al/Fe. The hydrated cations in the middle layer were exchanged by the modifying agents, they are located on the surface of the clay layer to form active centers located in the interlayer between the modified clay minerals. These active centers have the ability to adsorb phosphorus and lock them into the structure of the modified bentonite. The adsorption process of phosphate anions in solution on the surface of solid materials depends on many factors such as: the nature of the adsorbent, the mass of the adsorbent, the concentration of the blocking ion, the diffusion rate, the concentration, the reaction time, the pH of the solution, the reaction temperature, etc.
3.5.1. Determination of factors affecting the phosphorus adsorption capacity of modified bentonite
3.5.1.1. Effect of stirring speed
In this study, the adsorption capacity of phosphorus in synthetic aqueous solutions of modified bentonite samples at different stirring speeds was compared. The adsorption conversion (or adsorption efficiency) Hx% was calculated according to formula (2.2). The x index below indicates the stirring speeds of 150, 170, 200 and 240 rpm, respectively. The mass of adsorbent used was 1 g/L, the phosphate concentration (calculated as P) was 20 mgP/l (Appendix P11). The results of the study are presented in Table 3.24.
From the data shown in Table 3.24, it can be seen that the Hx adsorption efficiency (%) of stirring speed 170; 200 and 240 rpm is not much different and is larger than that of stirring speed at 150 rpm. Under this condition, the speed